
Complex Mixture Analysis
AMDOR spectroscopy
We have developped an experimental approach, Automated Microwave Double Resonance (AMDOR) spectroscopy, to rapidly determine the rotational constants of chemical compounds without a priori knowledge of elemental composition or molecular structure.
This task is achieved by rapidly acquiring the classical 1D (frequency vs. intensity) broadband spectrum of a molecule using chirped-pulse (CP) Fourier transform microwave (FTMW) spectroscopy, and subsequently analyzing it in near-real time using complementary cavity FTMW detection and double resonance (DR), hence producing a 2D spectrum. AMDOR measurements provide a unique "barcode" for each compound from which rotational constants can be extracted.
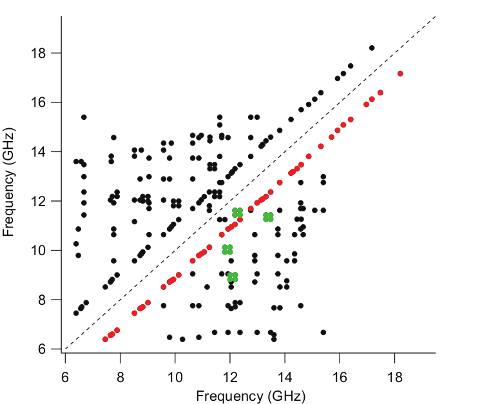
A key advantage of AMDOR lies in the capability to rapidly construct the energy level diagram of a molecule based solely on experimental observations. We are currently developing scripts allowing to determine the rotational constants from a subset of DR matches. Rotational constants are presently determined from DR matches using a script that has been written in Python and incorporates the SPFIT/SPCAT suite of programs, which is particularly efficient for fitting rotational constants of rigid molecules. This script (available in the resources section) requires only 4 DR matches between 5 frequencies as input: those of four a-type transitions, two from each of two a-ladders, and one cross-ladder transition connecting these two a-ladders.
Although the initial focus of the technique is on rapid rotational analysis of a pure sample, AMDOR measurements inherently resolve mixtures into individual components by identifying distinct networks of linked lines prior to subsequent assignment. In addition to determining the composition of an unknown sample, the present methodology might be useful as a characterization technique for small molecules. For instance, NMR and mass spectroscopy are routinely used in organic chemistry to verify the existence and purity of a compound formed in a chemical reaction. With the AMDOR approach outlined here, determination of rotational constants could provide complementary evidence for compound characterization.
Find more about the project:
Automated microwave double resonance spectroscopy: A tool to identify and characterize chemical compounds. M. A. Martin-Drumel, M. C. McCarthy, D. Patterson, B. A. McGuire, and K. N. Crabtree. The Journal of Chemical Physics 144, 124202 (2016)
Microwave spectral taxonomy
It is the latter category that tend to be the difficult ones."
US Secretary of Defense Donald Rumsfeld (february, 12 2002)
With the development of broadband CP-FTMW techniques, it is now practical to perform unbiased spectroscopic surveys in the microwave region, but disentangling a rich spectrum with many unknown species remains daunting. Microwave spectral taxonomy is a variant of AMDOR spectroscopy dedicated to the investigation of rich mixtures (e.g. two precursors excited by discharge). It involves acquiring a broadband rotational spectrum of such a mixture, categorizing individual lines based on their relative intensities under series of assays to group lines that might share common carriers, and finally, linking rotational transitions of individual chemical compounds within each category using double resonance techniques.
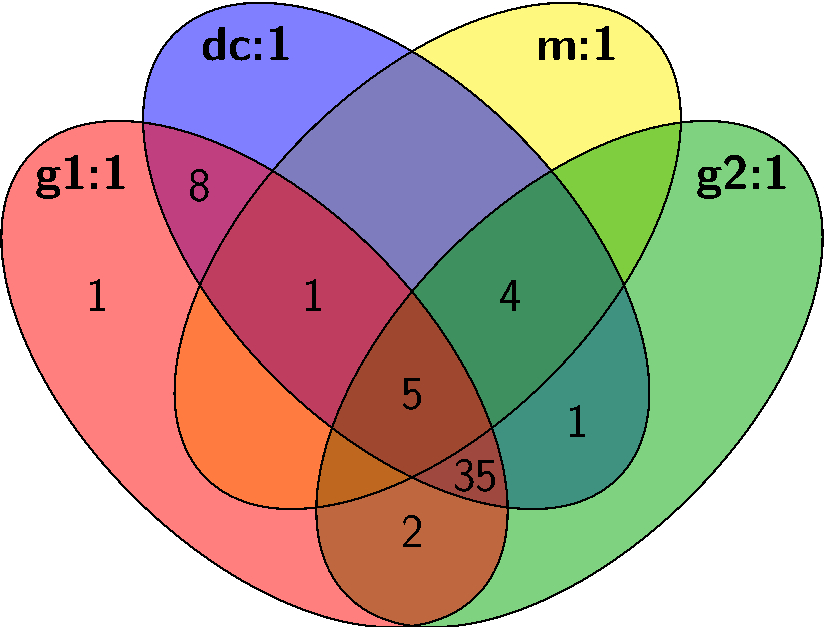
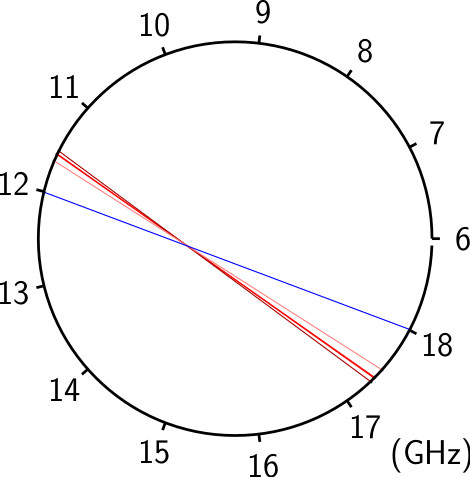
From these series of measurements and assays, rotational transitions from distinct chemical compounds can be empirically identified and sorted without the need for any theoretical guidance or input. Significant automation greatly enhances the overall efficiency, enabling rapid, exhaustive testing with minimal manual intervention. With spectral taxonomy, routine analysis of broadband rotational spectra of complex gas mixtures and identification of new, unanticipated molecules is now within reach.
Find more about the project:
Microwave spectral taxonomy: A semi-automated combination of chirped-pulse and cavity Fourier-transform microwave spectroscopy. K. N. Crabtree, M. A. Martin-Drumel, G. G. Brown, S. A. Gaster, T. M. Hall, and M. C. McCarthy. The Journal of Chemical Physics 144, 124201 (2016)