Hydra-7@ADC Status
|
Hydra has been moved to the new data center, updates are at the
Data Center Move page. You can view the list of all the available modules: as an HTML document, or a plain ASCII text file. You can also check the bandwidth between SAO and HDC. You can select to have this page refreshed every 5m, 20m, or 1hr, this one will auto-refresh every 5m. |
-
Usage

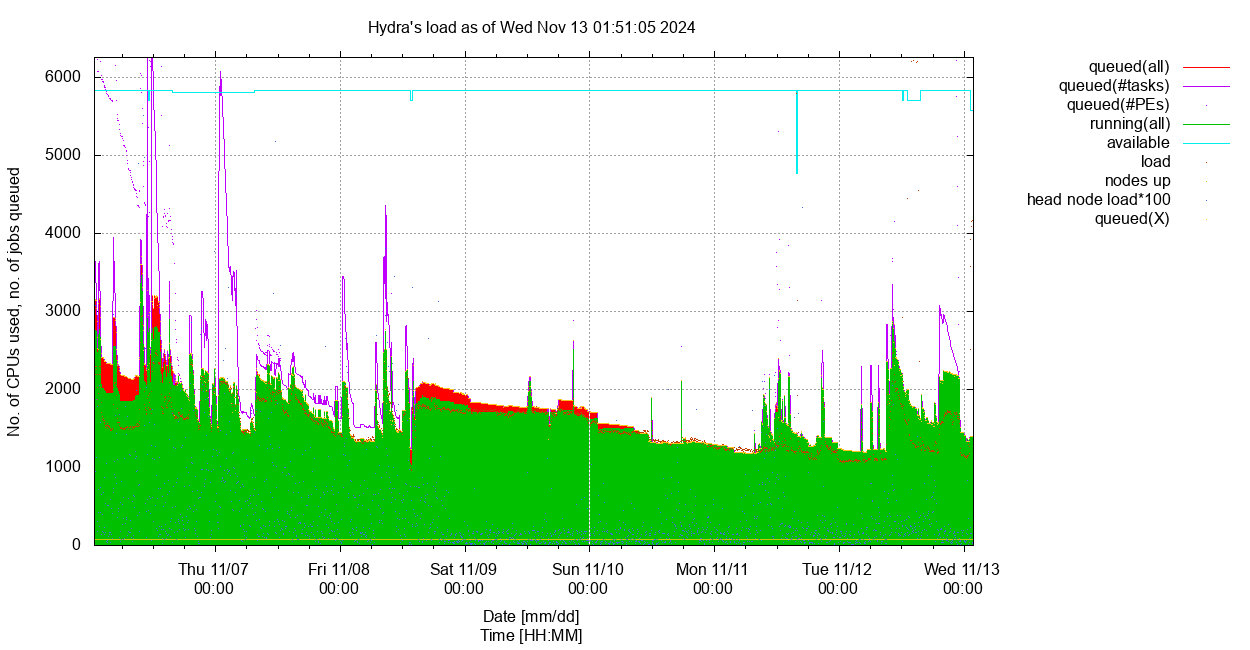
Current snapshot sorted by nodes' . Usage vs time, for length= and user= highlighted.
As of Wed Mar 18 07:27:03 2026: #CPUs/nodes 5476/74, 0 down.
Loads: head node: 0.33, login nodes: 2.43, 0.08, 0.00, 0.00; NSDs: 0.20, 0.30, 1.57, 3.56, 3.68; licenses: none used.
Queues status: 8 disabled, 36 need attention, none in error state.
14 users with running jobs (slots/jobs):
byerlyp=15/3 chippsa=64/1 hagemannm=16/2 hinckleya=10/1 jmcclung=256/1 lingof=1 morrisseyd=190/64 nelsonjo=10/1 qzhu=20/2 santosbe=6/1 sossajef=9/3 triznam=5/1 uribeje=60/3 yisraell=48/1 Current load: 719.9, #running (slots/jobs): 710/85, usage: 13.0%, efficiency: 101.4%
no job in any of the queues.
75 users have/had running or queued jobs over the past 7 days, 92 over the past 15 days. 111 over the past 30 days.
Click on the tabs to view each section, on the plots to view larger versions.
You can view the current cluster snapshot sorted by name, no. cpu, usage, load or memory, and
view the past load for 7, or 15, or 30 days as well as highlight a given user by selecting the corresponding options in the drop down menus.{}
This page was last updated on Wednesday, 18-Mar-2026 07:32:27 EDT with mk-webpage.pl ver. 7.3/1 (Oct 2025/SGK) in 1:14. -
Warnings
Oversubscribed Jobs
As of Wed Mar 18 07:27:04 EDT 2026 (2 oversubscribed jobs, showing no more than 3 per user)

Total running (PEs/jobs) = 710/85, 0 queued (job), showing only oversubscribed jobs (cpu% > 133% & age > 1h) for all users.
     jobID name            user                age nPEs      cpu% queue     node taskID
  12763671 illumi_21115FL- sossajef          08:59    4    177.5% mThC.q   64-08
  12764198 illumi_21115FL- sossajef          07:18    4    172.1% mThC.q   64-09

⇒ Equivalent to 6.0 overused CPUs: 8 CPUs used at 174.8% on average.
Inefficient Jobs
As of Wed Mar 18 07:27:04 EDT 2026 (8 inefficient jobs, showing no more than 3 per user)

Total running (PEs/jobs) = 710/85, 0 queued (job), showing only inefficient jobs (cpu% < 33% & age > 1h) for all users.
     jobID name            user                age nPEs      cpu% queue     node taskID
  12190422 stairwayAZ.job  byerlyp          +29:21    5     19.9% lThM.q   64-17
  12195552 stairwayNE.job  byerlyp          +29:18    5     19.9% lThM.q   76-04
  12198833 stairwayCAR.job byerlyp          +28:20    5     19.7% lThM.q   76-14
  12510406 krakenuniq_Scri yisraell          +7:07   48      0.0% mThC.q   65-15
  12586423 treemix_batch   uribeje           +6:16   20      5.0% lThM.q   76-07
  12647567 treemix_batch   uribeje           +5:22   20      5.0% lThM.q   93-04
  12762748 treemix_batch   uribeje           23:03   20      5.0% lThM.q   76-12
  12763555 BPP_rajah       chippsa           20:41   64     13.3% mThC.q   76-13

⇒ Equivalent to 172.5 underused CPUs: 187 CPUs used at 7.7% on average.
Nodes with Excess Load
As of Wed Mar 18 07:27:05 EDT 2026 (8 nodes have a high load, offset=1.5)

                #slots        excess
    node  #CPUs   used   load   load
 -----------------------------------
   64-08     40      4    7.4    3.4 *
   64-09     40      4    7.1    3.1 *
   65-17     64     64  129.1   65.1 *
   65-20     64     56  112.1   56.1 *
   65-22     64     64  128.1   64.1 *
   65-28     64      0    9.9    9.9 *
   76-02    192      0    4.1    4.1 *
   93-02     72     72  144.9   72.9 *

         Total excess load = 278.6
High Memory Jobs
Statistics
  User                     nSlots       memory        memory         vmem     maxvmem   ratio
  Name                      used        reserved      used           used     used [TB] resd/maxvm
--------------------------------------------------------------------------------------------------
  uribeje                 60  38.2%  1.7578  58.8%   0.0404  16.4%   0.0406   0.0406      43.3
  morrisseyd              62  39.5%  0.9688  32.4%   0.1809  73.6%   0.2029   0.2630       3.7
  qzhu                    10   6.4%  0.1953   6.5%   0.0135   5.5%   0.0151   0.0161      12.1
  byerlyp                 15   9.6%  0.0586   2.0%   0.0100   4.1%   0.0101   0.0101       5.8
  hinckleya               10   6.4%  0.0098   0.3%   0.0010   0.4%   0.0013   0.0015       6.5
==================================================================================================
  Total                  157         2.9902          0.2459          0.2699   0.3314       9.0
Warnings
68 high memory jobs produced a warning:
    3 for byerlyp
   61 for morrisseyd
    1 for qzhu
    3 for uribeje
Details for each job can be found here.
-
Breakdown by Queue

Select length:
Current Usage by Queue
Total Limit Fill factor Efficiency sThC.q=1 mThC.q=136 lThC.q=390 uThC.q=0 527 5056 10.4% 135.6% sThM.q=0 mThM.q=82 lThM.q=85 uThM.q=0 167 4680 3.6% 418.6% sTgpu.q=0 mTgpu.q=0 lTgpu.q=0 qgpu.iq=0 0 104 0.0% uTxlM.rq=0 0 536 0.0% lThMuVM.tq=0 0 384 0.0% lTb2g.q=0 0 2 0.0% lTIO.sq=0 0 8 0.0% lTWFM.sq=0 0 4 0.0% qrsh.iq=16 16 68 23.5% 1.3% Total: 710
-
Avail Slots/Wait Job(s)
Available Slots
As of Wed Mar 18 07:27:04 EDT 2026

4490 avail(slots), free(load)=4915.8, unresd(mem)=34067.3G, for hgrp=@hicpu-hosts and minMem=1.0G/slot
  total(nCPU)      5120 total(mem)   39.8T
  unused(slots)    4490 unused(load) 5109.8  ie:  87.7%  99.8%
  unreserved(mem) 35.0T unused(mem)  38.2T  ie:  87.9%  96.0%
  unreserved(mem)  8.0G unused(mem)   8.7G per unused(slots)

4066 avail(slots), free(load)=4476.3, unresd(mem)=29943.4G, for hgrp=@himem-hosts and minMem=1.0G/slot
  total(nCPU)      4680 total(mem)   35.8T
  unused(slots)    4066 unused(load) 4670.3  ie:  86.9%  99.8%
  unreserved(mem) 31.0T unused(mem)  34.4T  ie:  86.5%  96.0%
  unreserved(mem)  7.8G unused(mem)   8.7G per unused(slots)

408 avail(slots), free(load)=408.0, unresd(mem)=8063.0G, for hgrp=@xlmem-hosts and minMem=1.0G/slot
  total(nCPU)       408 total(mem)    7.9T
  unused(slots)     408 unused(load) 408.0  ie: 100.0% 100.0%
  unreserved(mem)  7.9T unused(mem)   7.3T  ie: 100.0%  93.3%
  unreserved(mem) 19.8G unused(mem)  18.4G per unused(slots)

104 avail(slots), free(load)=104.0, unresd(mem)=754.2G, for hgrp=@gpu-hosts and minMem=1.0G/slot
  total(nCPU)       104 total(mem)    0.7T
  unused(slots)     104 unused(load) 104.0  ie: 100.0% 100.0%
  unreserved(mem)  0.7T unused(mem)   0.7T  ie: 100.0%  95.2%
  unreserved(mem)  7.3G unused(mem)   6.9G per unused(slots)
GPU Usage
Wed Mar 18 07:27:09 EDT 2026
hostgroup: @gpu-hosts (3 hosts)
                - --- memory (GB) ----  -  #GPU - --------- slots/CPUs ---------
hostname        -   total   used   resd -  a/u  - nCPU used   load - free unused
compute-50-01   -   503.3   15.6  487.7 -  4/0  -   64    0    0.0 -   64   64.0
compute-79-01   -   125.5   10.3  115.2 -  2/0  -   20    0    0.0 -   20   20.0
compute-79-02   -   125.5   10.0  115.5 -  2/0  -   20    0    0.1 -   20   19.9

Total GPU=8, used=0 (0.0%)
Waiting Job(s)
As of Wed Mar 18 07:27:05 EDT 2026
Overall Quota Usage
 quota rule           resource=value/limit             %used
 -------------------  -------------------------------  ------
 total_slots/1             slots=711/5960                    11.9% for *
 total_mem_res/2           mem_res=3.400T/35.78T              9.5% for * in queue uThM.q
 total_mem_res/1           mem_res=1.435T/39.94T              3.6% for * in queue uThC.q
 blast2GO/1                slots=4/110                        3.6% for *
-
Memory Usage
Reserved Memory, All High-Memory Queues

Select length:
Current Memory Quota Usage
As of Wed Mar 18 07:27:05 EDT 2026

quota rule                resource=value/limit              %used filter
---------------------------------------------------------------------------------------------------
total_mem_res/1           mem_res=1.435T/39.94T              3.6% for * in queue uThC.q
total_mem_res/2           mem_res=3.400T/35.78T              9.5% for * in queue uThM.q
Current Memory Usage by Compute Node, High Memory Nodes Only
hostgroup: @himem-hosts (54 hosts)
                - ----------- memory (GB) ------------  - --------- slots/CPUs ---------
hostname        -   avail   used   resd - unused unresd - nCPU used   load - free unused
compute-64-17   -   503.5   15.4   36.2 -  488.1  467.3 -   32    6    2.0 -   26   30.0
compute-64-18   -   503.5   14.7    3.2 -  488.8  500.3 -   32    1    1.5 -   31   30.5
compute-65-02   -   503.5   15.1    0.0 -  488.4  503.5 -   64    0    0.0 -   64   64.0
compute-65-03   -   503.5   15.7    0.0 -  487.8  503.5 -   64    0    0.2 -   64   63.8
compute-65-04   -   503.5   17.4    0.0 -  486.1  503.5 -   64    0    0.1 -   64   63.9
compute-65-05   -   503.5   20.1   32.0 -  483.4  471.5 -   64    2    2.0 -   62   62.0
compute-65-06   -   503.5   18.0    0.0 -  485.5  503.5 -   64    0    0.0 -   64   64.0
compute-65-07   -   503.5   22.2   16.0 -  481.3  487.5 -   64    1    1.0 -   63   63.0
compute-65-09   -   503.5   18.7   16.0 -  484.8  487.5 -   64    1    1.0 -   63   63.0
compute-65-10   -   503.5   28.7   32.0 -  474.8  471.5 -   64    2    2.0 -   62   62.0
compute-65-11   -   503.5   16.0    0.0 -  487.5  503.5 -   64    0    0.0 -   64   64.0
compute-65-12   -   503.5   20.4   16.0 -  483.1  487.5 -   64    1    1.0 -   63   63.0
compute-65-13   -   503.5   16.2    0.0 -  487.3  503.5 -   64    0    0.1 -   64   63.9
compute-65-14   -   503.5   15.0    0.0 -  488.5  503.5 -   64    0    0.0 -   64   64.0
compute-65-15   -   503.5   22.7  402.0 -  480.8  101.5 -   64   57    8.5 -    7   55.5
compute-65-16   -   503.5   15.7   10.0 -  487.8  493.5 -   64   10    0.9 -   54   63.1
compute-65-17   -   503.5   47.7    0.0 -  455.8  503.5 -   64   64  129.0 -    0  -65.0 [alarm (10)]
compute-65-18   -   503.5   17.8   16.0 -  485.7  487.5 -   64    1    1.0 -   63   63.0
compute-65-19   -   503.5   21.4   32.0 -  482.1  471.5 -   64    2    2.0 -   62   62.0
compute-65-20   -   503.5   64.4    0.0 -  439.1  503.5 -   64   56  112.0 -    8  -48.0 [alarm (10)]
compute-65-21   -   503.5   20.6   32.0 -  482.9  471.5 -   64    2    2.0 -   62   62.0
compute-65-22   -   503.5   46.9    0.0 -  456.6  503.5 -   64   64  128.1 -    0  -64.1 [alarm (10)]
compute-65-23   -   503.5   15.0    0.0 -  488.5  503.5 -   64    0    0.0 -   64   64.0
compute-65-24   -   503.5   29.8   64.0 -  473.7  439.5 -   64    4    4.0 -   60   60.0
compute-65-25   -   503.5   19.8   32.0 -  483.7  471.5 -   64    2    2.0 -   62   62.0
compute-65-26   -   503.5   19.0  420.0 -  484.5   83.5 -   64   10    1.0 -   54   63.0
compute-65-27   -   503.5   21.4   16.0 -  482.1  487.5 -   64    1    1.0 -   63   63.0
compute-65-28   -   503.5   16.7    0.0 -  486.8  503.5 -   64    0    8.9 -   64   55.0
compute-65-29   -   503.5   22.9   48.0 -  480.6  455.5 -   64    3    3.0 -   61   61.0
compute-65-30   -   503.5   15.4    0.0 -  488.1  503.5 -   64    0    0.0 -   64   64.0
compute-75-01   -  1007.5   25.2   64.1 -  982.3  943.4 -  128    4    4.0 -  124  124.0
compute-75-02   -  1007.5   34.2   80.0 -  973.3  927.5 -  128    5    5.0 -  123  123.0
compute-75-03   -   755.5   23.1   48.0 -  732.4  707.5 -  128    3    3.0 -  125  125.0
compute-75-04   -   755.5   23.1   48.0 -  732.4  707.5 -  128    3    3.0 -  125  125.0
compute-75-05   -   755.5   22.5   48.0 -  733.0  707.5 -  128    3    3.0 -  125  125.0
compute-75-06   -   755.5   15.7   16.0 -  739.8  739.5 -  128    1    1.0 -  127  127.0
compute-75-07   -   755.5  117.2  256.0 -  638.3  499.5 -  128   64   54.4 -   64   73.6
compute-76-03   -  1007.4   21.7   16.5 -  985.7  990.9 -  128    1    1.1 -  127  126.9
compute-76-04   -  1007.4   16.7   20.0 -  990.7  987.4 -  128    5    1.0 -  123  127.0
compute-76-05   -  1007.4   31.6   48.0 -  975.8  959.4 -  128    3    3.1 -  125  124.9
compute-76-06   -  1007.4   25.8   64.0 -  981.6  943.4 -  128    4    4.1 -  124  123.9
compute-76-07   -  1007.4   21.4  616.0 -  986.0  391.4 -  128   21    2.0 -  107  126.0
compute-76-08   -  1007.4   17.3   16.0 -  990.1  991.4 -  128    1    1.1 -  127  126.9
compute-76-09   -  1007.4   18.4   16.0 -  989.0  991.4 -  128    1    1.1 -  127  127.0
compute-76-10   -  1007.4   19.8   16.0 -  987.6  991.4 -  128    1    1.0 -  127  127.0
compute-76-11   -  1007.4   76.1  256.0 -  931.3  751.4 -  128   64   24.8 -   64  103.2
compute-76-12   -  1007.4   16.9  600.0 -  990.5  407.4 -  128   20    1.1 -  108  127.0
compute-76-13   -  1007.4   15.5  512.0 -  991.9  495.4 -  128   64    6.8 -   64  121.2
compute-76-14   -  1007.4   25.1   52.0 -  982.3  955.4 -  128    7    3.0 -  121  125.0
compute-84-01   -   881.1  108.9   64.0 -  772.2  817.1 -  112    4    4.0 -  108  108.0
compute-93-01   -   503.8   22.6  200.0 -  481.2  303.8 -   64   10    9.1 -   54   54.9
compute-93-02   -   755.6   51.1    2.0 -  704.5  753.6 -   72   72  144.9 -    0  -72.9 [alarm (10)]
compute-93-03   -   755.6   18.3   16.0 -  737.3  739.6 -   72    1    1.0 -   71   71.0
compute-93-04   -   755.6   17.1  600.0 -  738.5  155.6 -   72   20    1.0 -   52   71.0
                   ======= ===== ======                   ==== ====  =====
Totals             36638.0 1456.1 4898.0                   4680  672  698.1
                       ==>   4.0%  13.4%                  ==>  14.4%  14.9%
Most unreserved/unused memory (991.4/990.1GB) is on compute-76-08 with 127/126.9 slots/CPUs free/unused.

hostgroup: @xlmem-hosts (4 hosts)
                - ----------- memory (GB) ------------  - --------- slots/CPUs ---------
hostname        -   avail   used   resd - unused unresd - nCPU used   load - free unused
compute-76-01   -  1511.4   17.8   -0.0 - 1493.6 1511.4 -  192    0    0.1 -  192  191.9
compute-76-02   -  1511.4  489.8   -0.0 - 1021.6 1511.4 -  192    0    4.1 -  192  187.9
compute-93-05   -  2016.3   16.7    0.0 - 1999.6 2016.3 -   96    0    0.0 -   96   96.0
compute-93-06   -  3023.9   15.4    0.0 - 3008.5 3023.9 -   56    0    0.0 -   56   56.0
                   ======= ===== ======                   ==== ====  =====
Totals             8063.0  539.7    0.0                    536    0    4.1
                       ==>   6.7%   0.0%                  ==>   0.0%   0.8%
Most unreserved/unused memory (3023.9/3008.5GB) is on compute-93-06 with 56/56.0 slots/CPUs free/unused.
Past Memory Usage vs Memory Reservation
Past memory use in hi-mem queues between 03/11/26 and 03/18/26
queues: ?ThM.q
                ----------- total ---------  -------------------- mean --------------------
user                 no. of    elapsed time   eff. reserved  maxvmem  average  ratio
name                jobs/slots     [d]        [%]     [GB]     [GB]     [GB]   resd/maxvmem
--------------- -------------- ------------ ----- --------- -------- --------- ------------
jhora                  2/64         0.00      7.3     60.0     89.7      0.1      0.7
martinezl2             3/18         0.00      9.0     40.0      0.2      0.1    226.4 > 2.5
edies                  1/10         0.00     26.2     50.0     20.2     17.2      2.5
suttonm                3/3          0.00    144.7     40.0      8.7      7.3      4.6 > 2.5
szieba                25/1000       0.02      2.6      0.0     39.1     32.2      0.0
athalappila            8/64         0.04     28.1     96.0     30.9      6.7      3.1 > 2.5
nelsonjo               8/192        0.04     74.0    384.0    288.2      3.2      1.3
hinckleya              8/40         0.06     96.1     39.6      4.2      3.9      9.4 > 2.5
lingof                 1/1          0.06   1198.0     32.0     30.8     20.1      1.0
hchong                 3/3          0.08     97.6     16.0     16.0      5.4      1.0
nevesk               140/1664       0.08     78.2    550.0     11.9      6.2     46.1 > 2.5
xuj                    2/40         0.11    107.7    400.0     12.7     12.7     31.4 > 2.5
afoster                2/2          0.18     99.6     24.0      9.1      5.8      2.6 > 2.5
santossam             24/480        0.19     39.7    120.0     37.8     31.6      3.2 > 2.5
palmerem               4/18         0.31     85.7    160.6     80.9     73.1      2.0
bourkeb               39/441        0.71     81.2    778.4    693.7      5.9      1.1
jourdain-fievetl     402/3618       0.77    150.8    900.0    277.9      1.1      3.2 > 2.5
johnsonsj            118/118        0.87     98.2     32.0     29.3     16.0      1.1
ariasc                 6/140        1.18     44.7    581.5    498.4     17.3      1.2
cabreroa               1/8          1.26     87.6      0.0     90.0     37.1      0.0
ramosi                 3/15         1.40     19.8     10.0     28.3     28.2      0.4
zehnpfennigj           2/10         1.58     20.0     18.0      0.6      0.5     30.4 > 2.5
byerlyp               16/80         2.03     35.0     38.1      1.0      0.7     37.5 > 2.5
pappalardop         1464/1464       2.06     99.3    298.5      0.2      0.2   1374.8 > 2.5
qzhu                  20/92         2.09     72.8    157.6     29.8     11.3      5.3 > 2.5
santosbe              40/490        3.12     10.1    959.2     17.2      7.4     55.8 > 2.5
willishr              12/152        3.15     40.7     67.7     89.4      6.4      0.8
graujh                 2/64         3.85     10.4    240.0     99.5      0.4      2.4
niez                 497/7200       4.47     72.5    189.9    129.5     19.0      1.5
sandoval-velascom     76/76         5.65    100.6     12.0      6.2      5.9      1.9
uribeje               86/954        8.68    183.4    332.0     25.2      3.1     13.2 > 2.5
longk                153/612        9.71     72.1    120.0     37.9      4.5      3.2 > 2.5
beckerm               39/312       13.21     32.0    103.9     21.9     10.3      4.7 > 2.5
kistlerl            6644/6644      14.09    105.7     48.0      8.7      6.4      5.5 > 2.5
woodh                288/1152      36.88     88.6    100.0     39.7     16.4      2.5 > 2.5
granquistm           210/2100      44.46     85.6    160.0    136.5     42.4      1.2
morrisseyd          9123/9192     152.85     97.3     16.3      5.1      3.2      3.2 > 2.5
--------------- -------------- ------------ ----- --------- -------- --------- ------------
all                19475/38533    315.25     89.8     87.7     38.8     11.5      2.3
---
queues: ?TxlM.rq
                ----------- total ---------  -------------------- mean --------------------
user                 no. of    elapsed time   eff. reserved  maxvmem  average  ratio
name                jobs/slots     [d]        [%]     [GB]     [GB]     [GB]   resd/maxvmem
--------------- -------------- ------------ ----- --------- -------- --------- ------------
--------------- -------------- ------------ ----- --------- -------- --------- ------------
all                    0/0          0.00
-
Resource Limits
    Limit slots for all users together
    users * to slots=5960
    users * queues sThC.q,lThC.q,mThC.q,uThC.q to slots=5176
    users * queues sThM.q,mThM.q,lThM.q,uThM.q to slots=4680
    users * queues uTxlM.rq to slots=536
    users * queues sTgpu.q,mTgpu.q,lTgpu.q to slots=104

    Limit slots/user for all queues
    users {*} to slots=840

    Limit slots/user in hiCPU queues
    users {*} queues {sThC.q} to slots=840
    users {*} queues {mThC.q} to slots=840
    users {*} queues {lThC.q} to slots=431
    users {*} queues {uThC.q} to slots=143

    Limit slots/user for hiMem queues
    users {*} queues {sThM.q} to slots=840
    users {*} queues {mThM.q} to slots=585
    users {*} queues {lThM.q} to slots=390
    users {*} queues {uThM.q} to slots=73

    Limit slots/user for xlMem restricted queue
    users {*} queues {uTxlM.rq} to slots=536

    Limit total reserved memory for all users per queue type
    users * queues sThC.q,mThC.q,lThC.q,uThC.q to mem_res=40902G
    users * queues sThM.q,mThM.q,lThM.q,uThM.q to mem_res=36637G
    users * queues uTxlM.rq to mem_res=8063G

    Limit reserved memory per user for specific queues
    users {*} queues sThC.q,mThC.q,lThC.q,uThC.q to mem_res=10225G
    users {*} queues sThM.q,mThM.q,lThM.q,uThM.q to mem_res=9159G
    users {*} queues uTxlM.rq to mem_res=8063G

    Limit slots/user for interactive (qrsh) queues
    users {*} queues {qrsh.iq} to slots=16

    Limit GPUs for all users in GPU queues to the avail no of GPUs
    users * queues {sTgpu.q,mTgpu.q,lTgpu.q,qgpu.iq} to GPUS=8

    Limit GPUs per user in all the GPU queues
    users {*} queues sTgpu.q,mTgpu.q,lTgpu.q,qgpu.iq to GPUS=4

    Limit GPUs per user in each GPU queues
    users {*} queues {sTgpu.q} to GPUS=4
    users {*} queues {mTgpu.q} to GPUS=3
    users {*} queues {lTgpu.q} to GPUS=2
    users {*} queues {qgpu.iq} to GPUS=1

    Limit to set aside a slot for blast2GO
    users * queues !lTb2g.q hosts {@b2g-hosts} to slots=110
    users * queues lTb2g.q hosts {@b2g-hosts} to slots=1
    users {*} queues lTb2g.q hosts {@b2g-hosts} to slots=1

    Limit total bigtmp concurrent request per user
    users {*} to big_tmp=25

    Limit total number of idl licenses per user
    users {*} to idlrt_license=102

    Limit slots for io queue per user
    users {*} queues {lTIO.sq} to slots=8

    Limit slots for io queue per user
    users {*} queues {lTWFM.sq} to slots=2

    Limit the number of concurrent jobs per user for some queues
    users {*} queues {uTxlM.rq} to no_concurrent_jobs=3
    users {*} queues {lTIO.sq} to no_concurrent_jobs=2
    users {*} queues {lTWFM.sq} to no_concurrent_jobs=1
    users {*} queues {qrsh.iq} to no_concurrent_jobs=4
    users {*} queues {qgpu.iq} to no_concurrent_jobs=1
-
Disk Usage & Quota
As of Wed Mar 18 05:06:02 EDT 2026
Disk Usage
Filesystem                              Size     Used    Avail Capacity  Mounted on

netapp-fas83:/vol_home                  22.36T   18.06T    4.30T  81%/12%  /home
netapp-fas83-n02:/vol_data_public      332.50T   45.04T  287.46T  14%/2%   /data/public
gpfs02:public                          800.00T  508.02T  291.98T  64%/35%  /scratch/public
gpfs02:nmnh_bradys                      25.00T   18.79T    6.21T  76%/59%  /scratch/bradys
gpfs02:nmnh_kistlerl                   120.00T   86.86T   33.14T  73%/14%  /scratch/kistlerl
gpfs02:nmnh_meyerc                      25.00T   20.39T    4.61T  82%/7%   /scratch/meyerc
gpfs02:nmnh_corals                      60.00T   59.89T  109.79G 100%/24%  /scratch/nmnh_corals
gpfs02:nmnh_ggi                        130.00T   36.46T   93.54T  29%/15%  /scratch/nmnh_ggi
gpfs02:nmnh_lab                         25.00T   11.55T   13.45T  47%/11%  /scratch/nmnh_lab
gpfs02:nmnh_mammals                     35.00T   27.90T    7.10T  80%/39%  /scratch/nmnh_mammals
gpfs02:nmnh_mdbc                        60.00T   55.88T    4.12T  94%/26%  /scratch/nmnh_mdbc
gpfs02:nmnh_ocean_dna                   90.00T   69.37T   20.63T  78%/5%   /scratch/nmnh_ocean_dna
gpfs02:nzp_ccg                          45.00T   34.63T   10.37T  77%/3%   /scratch/nzp_ccg
gpfs01:ocio_dpo                         10.00T  152.05G    9.85T   2%/1%   /scratch/ocio_dpo
gpfs01:ocio_ids                          5.00T    0.00G    5.00T   0%/1%   /scratch/ocio_ids
gpfs02:pool_kozakk                      12.00T   10.67T    1.33T  89%/2%   /scratch/pool_kozakk
gpfs02:pool_sao_access                  50.00T    4.79T   45.21T  10%/9%   /scratch/pool_sao_access
gpfs02:pool_sao_rtdc                    20.00T  908.33G   19.11T   5%/1%   /scratch/pool_sao_rtdc
gpfs02:sao_atmos                       350.00T  259.32T   90.68T  75%/12%  /scratch/sao_atmos
gpfs02:sao_cga                          25.00T    9.44T   15.56T  38%/28%  /scratch/sao_cga
gpfs02:sao_tess                         50.00T   23.25T   26.75T  47%/83%  /scratch/sao_tess
gpfs02:scbi_gis                        184.00T   74.79T  109.21T  41%/9%   /scratch/scbi_gis
gpfs02:nmnh_schultzt                    35.00T   21.91T   13.09T  63%/75%  /scratch/schultzt
gpfs02:serc_cdelab                      15.00T   10.13T    4.87T  68%/18%  /scratch/serc_cdelab
gpfs02:stri_ap                          25.00T   18.96T    6.04T  76%/1%   /scratch/stri_ap
gpfs01:sao_sylvain                     145.00T    8.88T  136.12T   7%/3%   /scratch/sylvain
gpfs02:usda_sel                         25.00T    8.46T   16.54T  34%/31%  /scratch/usda_sel
gpfs02:wrbu                             50.00T   40.98T    9.02T  82%/14%  /scratch/wrbu
nas1:/mnt/pool/public                  175.00T  102.39T   72.61T  59%/1%   /store/public
nas1:/mnt/pool/nmnh_bradys              40.00T   14.58T   25.42T  37%/1%   /store/bradys
nas2:/mnt/pool/n1p3/nmnh_ggi            90.00T   36.28T   53.72T  41%/1%   /store/nmnh_ggi
nas2:/mnt/pool/nmnh_lab                 40.00T   16.35T   23.65T  41%/1%   /store/nmnh_lab
nas2:/mnt/pool/nmnh_ocean_dna           70.00T   31.03T   38.97T  45%/1%   /store/nmnh_ocean_dna
nas1:/mnt/pool/nzp_ccg                 264.66T  119.18T  145.47T  46%/1%   /store/nzp_ccg
nas2:/mnt/pool/nzp_cec                  40.00T   20.71T   19.29T  52%/1%   /store/nzp_cec
nas2:/mnt/pool/n1p2/ocio_dpo            50.00T    3.08T   46.92T   7%/1%   /store/ocio_dpo
nas2:/mnt/pool/n1p1/sao_atmos          750.00T  410.13T  339.87T  55%/1%   /store/sao_atmos
nas2:/mnt/pool/n1p2/nmnh_schultzt       80.00T   24.96T   55.04T  32%/1%   /store/schultzt
nas1:/mnt/pool/sao_sylvain              50.00T    9.42T   40.58T  19%/1%   /store/sylvain
nas1:/mnt/pool/wrbu                     80.00T   10.02T   69.98T  13%/1%   /store/wrbu
nas1:/mnt/pool/admin                    20.00T    8.04T   11.96T  41%/1%   /store/admin
You can view plots of disk use vs time, for the past 7, 30, or 120 days; as well as plots of disk usage by user, or by device (for the past 90 or 240 days respectively).Notes
Capacity shows % disk space full and % of inodes used.
When too many small files are written on a disk, the file system can become full because it is unable to keep track of new files.
The % of inodes should be lower or comparable to the % of disk space used.
If it is much larger, the disk can become unusable before it gets full.
Disk Quota Report
Volume=NetApp:vol_data_public, mounted as /data/public
                     --  disk   --     --  #files --     default quota:  4.50TB/10.0M
Disk                 usage   %quota    usage  %quota     name, affiliation - username (indiv. quota)
-------------------- ------- ------    ------ ------     -------------------------------------------
/data/public          4.13TB  91.8%     5.07M  50.7%     Alicia Talavera, NMNH - talaveraa

Volume=NetApp:vol_home, mounted as /home
                     --  disk   --     --  #files --     default quota: 384.0GB/10.0M
Disk                 usage   %quota    usage  %quota     name, affiliation - username (indiv. quota)
-------------------- ------- ------    ------ ------     -------------------------------------------
/home                371.1GB  96.6%     2.95M  29.5% *** Brian Bourke, WRBU - bourkeb
/home                369.3GB  96.2%     0.09M   0.9% *** Rebeka Tamasi Bottger, SAO/OIR - rbottger
/home                363.6GB  94.7%     0.27M   2.7%     Juan Uribe, NMNH - uribeje
/home                350.9GB  91.4%     0.28M   2.8%     Paul Cristofari, SAO/SSP - pcristof
/home                345.3GB  89.9%     0.70M   7.0%     Adam Foster, SAO/HEA - afoster
/home                329.1GB  85.7%     0.00M   0.0%     Allan Cabrero, NMNH - cabreroa

Volume=GPFS:scratch_public, mounted as /scratch/public
                     --  disk   --     --  #files --     default quota: 15.00TB/39.8M
Disk                 usage   %quota    usage  %quota     name, affiliation - username (indiv. quota)
-------------------- ------- ------    ------ ------     -------------------------------------------
/scratch/public      17.20TB 114.7%     3.02M   7.6% *** Ting Wang, NMNH - wangt2
/scratch/public      13.50TB  90.0%     2.09M   5.3%     Solomon Chak, SERC - chaks
/scratch/public      13.50TB  90.0%     0.54M   1.4%     Carlos Arias, STRI - ariasc
/scratch/public      13.20TB  88.0%    31.22M  78.4%     Alberto Coello Garrido, NMNH - coellogarridoa
/scratch/public      13.20TB  88.0%     4.20M  10.5%     Kevin Mulder, NZP - mulderk
/scratch/public      12.90TB  86.0%    15.80M  39.7%     Brian Bourke, WRBU - bourkeb

Volume=GPFS:scratch_stri_ap, mounted as /scratch/stri_ap
                     --  disk   --     --  #files --     default quota:  5.00TB/12.6M
Disk                 usage   %quota    usage  %quota     name, affiliation - username (indiv. quota)
-------------------- ------- ------    ------ ------     -------------------------------------------
/scratch/stri_ap     14.60TB 292.0%     0.05M   0.0% *** Carlos Arias, STRI - ariasc

Volume=NAS:store_public, mounted as /store/public
                     --  disk   --     --  #files --     default quota:   0.0MB/0.0M
Disk                 usage   %quota    usage  %quota     name, affiliation - username (indiv. quota)
-------------------- ------- ------    ------ ------     -------------------------------------------
/store/public         4.80TB  96.1%        -      -  *** Madeline Bursell, OCIO - bursellm (5.0TB/0M)
/store/public         4.73TB  94.6%        -      -      Zelong Nie, NMNH - niez (5.0TB/0M)
/store/public         4.51TB  90.1%        -      -      Alicia Talavera, NMNH - talaveraa (5.0TB/0M)
/store/public         4.39TB  87.8%        -      -      Mirian Tsuchiya, NMNH/Botany - tsuchiyam (5.0TB/0M)
SSD Usage
  Node   -------------------------- /ssd -------------------------------
  Name     Size   Used  Avail    Use% |   Resd  Avail  Resd% | Resd/Used
 64-17    1.75T  12.3G  1.73T    0.7% |   0.0G  1.75T   0.0% |   0.00
 64-18    3.49T  24.6G  3.47T    0.7% |   0.0G  3.49T   0.0% |   0.00
 65-02    3.49T  24.6G  3.47T    0.7% |   0.0G  3.49T   0.0% |   0.00
 65-03    3.49T  24.6G  3.47T    0.7% |   0.0G  3.49T   0.0% |   0.00
 65-04    3.49T  24.6G  3.47T    0.7% |   0.0G  3.49T   0.0% |   0.00
 65-05    3.49T  24.6G  3.47T    0.7% |   0.0G  3.49T   0.0% |   0.00
 65-06    3.49T  24.6G  3.47T    0.7% |   0.0G  3.49T   0.0% |   0.00
 65-07    3.49T  24.6G  3.47T    0.7% |   0.0G  3.49T   0.0% |   0.00
 65-10    1.75T  21.5G  1.72T    1.2% |   0.0G  1.75T   0.0% |   0.00
 65-11    1.75T  12.3G  1.73T    0.7% |   0.0G  1.75T   0.0% |   0.00
 65-12    1.75T  12.3G  1.73T    0.7% |   0.0G  1.75T   0.0% |   0.00
 65-13    1.75T  12.3G  1.73T    0.7% |   0.0G  1.75T   0.0% |   0.00
 65-14    1.75T  12.3G  1.73T    0.7% |   0.0G  1.75T   0.0% |   0.00
 65-15    1.75T  12.3G  1.73T    0.7% |   0.0G  1.75T   0.0% |   0.00
 65-16    1.75T  12.3G  1.73T    0.7% |   0.0G  1.75T   0.0% |   0.00
 65-17    1.75T  12.3G  1.73T    0.7% |   0.0G  1.75T   0.0% |   0.00
 65-18    1.75T  12.3G  1.73T    0.7% |   0.0G  1.75T   0.0% |   0.00
 65-19    1.75T  12.3G  1.73T    0.7% |   0.0G  1.75T   0.0% |   0.00
 65-20    1.75T 118.8G  1.63T    6.6% |   0.0G  1.75T   0.0% |   0.00
 65-21    1.75T  12.3G  1.73T    0.7% |   0.0G  1.75T   0.0% |   0.00
 65-22    1.75T  12.3G  1.73T    0.7% |   0.0G  1.75T   0.0% |   0.00
 65-23    1.75T  12.3G  1.73T    0.7% |   0.0G  1.75T   0.0% |   0.00
 65-24    1.75T  12.3G  1.73T    0.7% |   0.0G  1.75T   0.0% |   0.00
 65-25    1.75T  12.3G  1.73T    0.7% |   0.0G  1.75T   0.0% |   0.00
 65-26    1.75T  12.3G  1.73T    0.7% | 199.7G  1.55T  11.2% |  16.25
 65-27    1.75T  12.3G  1.73T    0.7% |   0.0G  1.75T   0.0% |   0.00
 65-28    1.75T  12.3G  1.73T    0.7% |   0.0G  1.75T   0.0% |   0.00
 65-29    1.75T  12.3G  1.73T    0.7% |   0.0G  1.75T   0.0% |   0.00
 65-30    1.75T  12.3G  1.73T    0.7% |   0.0G  1.75T   0.0% |   0.00
 75-01    5.24T  37.9G  5.20T    0.7% |   0.0G  5.24T   0.0% |   0.00
 75-02    6.98T  50.2G  6.93T    0.7% |   0.0G  6.98T   0.0% |   0.00
 75-03    6.98T  50.2G  6.93T    0.7% |   0.0G  6.98T   0.0% |   0.00
 75-04    6.98T  50.2G  6.93T    0.7% |   0.0G  6.98T   0.0% |   0.00
 75-05    6.98T 113.7G  6.87T    1.6% |   0.0G  6.98T   0.0% |   0.00
 75-06    6.98T  50.2G  6.93T    0.7% |   0.0G  6.98T   0.0% |   0.00
 76-01    1.75T  12.3G  1.73T    0.7% |   0.0G  1.75T   0.0% |   0.00
 76-03    1.75T  12.3G  1.73T    0.7% |   0.0G  1.75T   0.0% |   0.00
 76-04    1.75T  12.3G  1.73T    0.7% |   0.0G  1.75T   0.0% |   0.00
 76-05    1.75T  12.3G  1.73T    0.7% |   0.0G  1.75T   0.0% |   0.00
 76-06    1.75T  12.3G  1.73T    0.7% |   0.0G  1.75T   0.0% |   0.00
 76-07    1.75T  12.3G  1.73T    0.7% |   0.0G  1.75T   0.0% |   0.00
 76-08    1.75T  12.3G  1.73T    0.7% |   0.0G  1.75T   0.0% |   0.00
 76-09    1.75T  12.3G  1.73T    0.7% |   0.0G  1.75T   0.0% |   0.00
 76-10    1.75T  12.3G  1.73T    0.7% |   0.0G  1.75T   0.0% |   0.00
 76-11    1.75T  12.3G  1.73T    0.7% |   0.0G  1.75T   0.0% |   0.00
 76-12    1.75T  12.3G  1.73T    0.7% |   0.0G  1.75T   0.0% |   0.00
 76-13    1.75T  12.3G  1.73T    0.7% |   0.0G  1.75T   0.0% |   0.00
 76-14    1.75T  14.3G  1.73T    0.8% |   0.0G  1.75T   0.0% |   0.00
 79-01    7.28T  51.2G  7.22T    0.7% |   0.0G  7.28T   0.0% |   0.00
 79-02    7.28T  51.2G  7.22T    0.7% |   0.0G  7.28T   0.0% |   0.00
 93-06    1.64T  11.3G  1.62T    0.7% |   0.0G  1.64T   0.0% |   0.00
         ---------------------------------------------------------------
 Total   141.8T  1.16T 140.7T    0.8% | 199.7G 141.6T   0.1% |   0.17
Note: the disk usage and the quota report are compiled 4x/day, the SSD usage is updated every 10m.