Disk Usage on Hydra-7

for the past 120 days

As of Sat May 17 05:06:02 EDT 2025

/home


/pool/public


/data/public


/scratch/public


/store/public


/data/admin


/pool/admin
/pool/kozakk


/pool/nmnh_ggi


/pool/sao_access


/pool/sao_rtdc


/pool/sylvain


/qnas/hydra


/scratch/admin


/scratch/dbs


/scratch/bradys


/scratch/kistlerl
/scratch/meyerc


/scratch/nmnh_corals


/scratch/nmnh_ggi


/scratch/nmnh_lab


/scratch/nmnh_mammals


/scratch/nmnh_mdbc


/scratch/nmnh_ocean_dna


/scratch/nzp_ccg


/scratch/ocio_dpo
/scratch/ocio_ids


/scratch/sao_atmos


/scratch/sao_cga


/scratch/sao_tess


/scratch/scbi_gis


/scratch/schultzt


/scratch/serc_cdelab


/scratch/stri_ap
/scratch/sylvain


/scratch/tmp


/scratch/usda_sel


/scratch/wrbu


/store/admin


/store/bradys


/store/nmnh_ggi


/store/nmnh_lab


/store/nmnh_ocean_dna
/store/nzp_ccg


/store/ocio_dpo


/store/sao_atmos


/store/schultzt


/store/sylvain


/store/wrbu


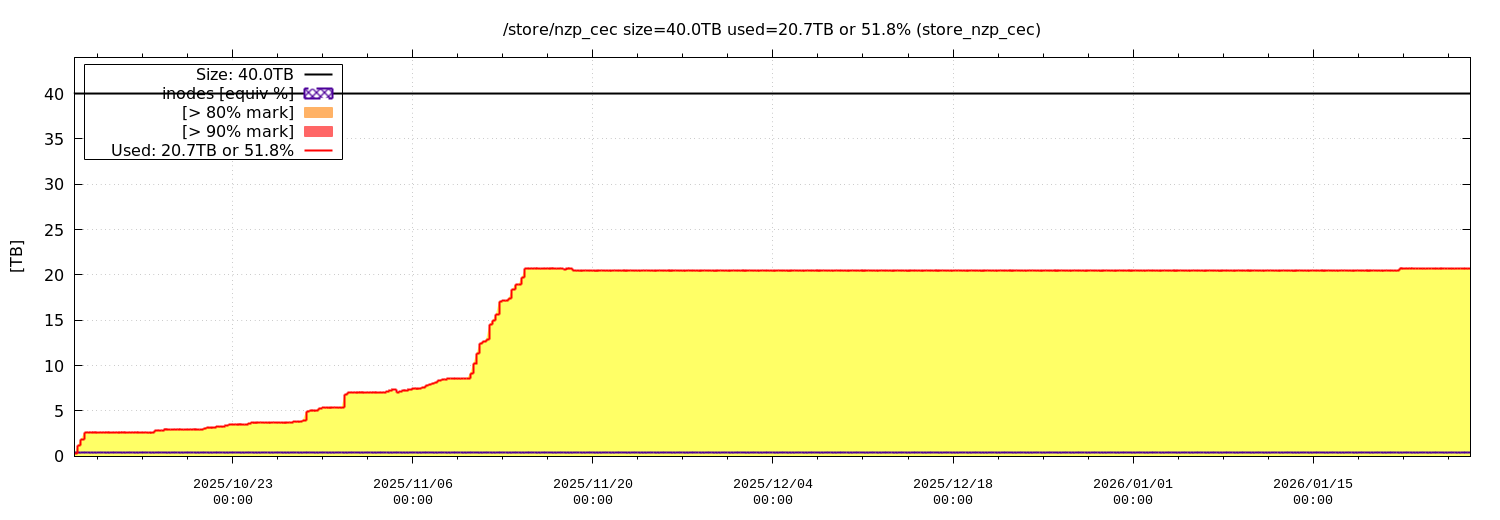
Notes
The orange and red indicate when the disk usage exceed 80% and 90% of its capacity respectively.
The disk performances degrade when the disks are nearly full.

The purple dotted lines shows the equivalent %(inodes) used.
The equiv %(inodes) should be lower or comparable to the space used.
If it is much larger, the disk can become unusable before it gets full, (i.e. too many small files).

The height of each plot is indicative of the respective disk size.

This page was last updated Saturday, 17-May-2025 10:41:47 EDT with mk-web-page.pl ver. 7.2/1 (Aug 2024/SGK)