1. Edit the script
First, we edit the script file jpllines.csh
#!/bin/csh -f
#identiy spectral line using JPL catalog
#
smauvspec vis=SgrB2_M.H2CO hann=3 strngl=-3.5 \
        interval=1000 catpath=$MIRCAT/jplcat/  \
        options=jplcat,restfreq,nobase,avall \
        lsrvel=61 veltype=lsr veldef=radio \
        axis=freq,amp device=/xs nxy=1,1
exit
The setup is similar to the previous case. Alternatively,
in this case, we select more molecules and set the molecular
strength
![]() instead of the default value
(
instead of the default value
(
![]() ). We require to average all the baselines
and plot the amplitude in a single spectrum
(options=nobase,avall and axis=freq,amp).
). We require to average all the baselines
and plot the amplitude in a single spectrum
(options=nobase,avall and axis=freq,amp).
2. Select the molecules in the tag file
Then, we mark the relevant molecules in the tag file (moltag.txt) by replacing 'n' with 'y' in the first column. The second column is the molecular tag number and the third column is the name of the molecules. A template of moltag.txt can be found from the web (a molecular name tag file for JPL catalog.)
n----1001----H-atom
n----2001----D-atom
n----3001----HD
n----4001----H2D+
n----7001----Li-6-H
n----8001----LiH
n----8002----Li-6-D
n----9001----LiD
n---12001----C-atom
n---13001----C-13-atom
n---13002----CH
n---13003----CH+
n---14001----N-atom
n---14002----N-atom-D-st
n---15001----NH
n---16001----O-atom
n---17001----OH
n---17002----NH3
n---17003----CH3D
n---17004----NH3-v2
...
y---30004----H2CO
...
y---32003----CH3OH
...
y---43002----HNCO
...
y---51001----HCCCN
...
y---60001----OCS
...
n---97003----Br-81-O(v=1)
n---98001----H2SO4
n---98002----HOBr-81
n---99001----Cl-37-ONO2
n---99002----HC7N
n--100001----C7O
n--102001----ClOOCl
n--104001----Cl-37-OOCl
n--111001----OBr-79-O
n--112001----Se-80-O2
n--112002----C8O
n--113001----OBr-81-O
n--123001----HC9N
n--124001----C9O
n--147001----HC11N
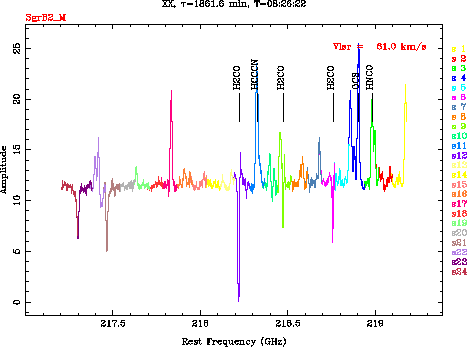
We have selected five molecules (![]() ,
, ![]() ,
,
![]() ,
, ![]() and
and ![]() ) for
identifications of the spectral lines.
) for
identifications of the spectral lines.
3. Execute the script
We now submit the script with the input from moltag.txt
jpllines.csh < moltag.txt
 |