1. Find interested line transition
There could be many line transitions contained in the entire 2 GHz spectral window. First, one might check the spectrum using smauvspec:
smauvspec vis=SgrB2_M.H2CO select=ant(2)(3) \
        interval=1000  axis=freq,both  device=/xs nxy=1,1
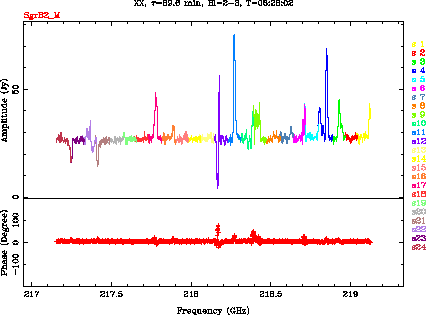
Fig.5.3 shows the 24 spectral chunks conatining many line transitions.
2. Find the line free channels
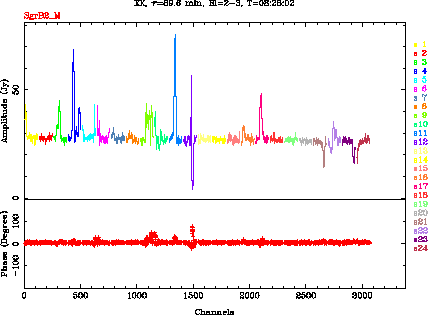
We now plot the spectrum on one of the baselines as function of channel numbers.
smauvspec vis=SgrB2_M.H2CO select=ant(2)(3) \
        interval=1000  axis=chan,both  device=/xs nxy=1,1
From Fig.5.4, line free channels might be defined. Careful users might want to go through all the baselines to make sure that the selected line-free channels are true for all the baselines.
3. Take out the continuum
The Miriad task uvlin since version 1.0 24-Jan-07 can handle uv data with multiple spectral windows with options=nowin.
It would be better to select line-free channels on both sides of the interested line feature so that uvlin can fit the continuum level. Also, one might choose several line-free windows in order to get a better fitting for the continuum level. Here is a usage of uvlin:
uvlin vis=SgrB2_M.H2CO chans=50,200,1650,1750,2300,2600 \
        out=SgrB2_M.H2CO.lin \
        order=1 mode=line options=nowin
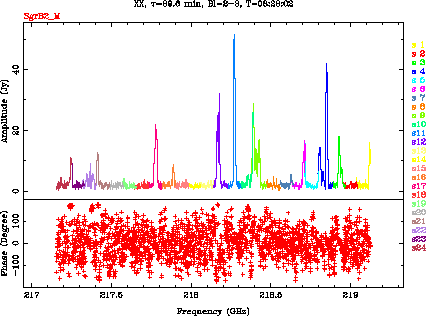
Fig.5.5 shows the spectrum (amplitude and phase) after the continuum level is subtracted. From this point, one might go on to make spectral line images.
 |