Assuming that the UV data has been calibrated for bandpass and antenna gains, one might wish to average the data in a long time interval to gain a higher S/N in the UV domain. The Miriad smauvspec provides an option to shift the spectrum to the rest frame with respect to the source. The systematic velocity with respect to the LSR frame can be input from the Keyword:lsrvel if no systematic source velocity is included in the on-line Doppler tracking. and the observatory velocity included in the Doppler tracking should be stored in the UV data. If the source is far away from the Doppler tracking source, one must use uvredo to compute the Doppler velocities prior to using smauvspec for spectral line identification.
smauvspec% inp smauvspec
  Task:   smauvspec
  vis      = SgrB2_M.H2CO           % vis data which has been
                                      calibrated
  select   = ant(3)(4)              % select one baseline
  interval = 1000                   % time interval for average.
  hann     = 3                      % do hanning smooth
  options  = jplcat,restfreq        % to turn on the catalog reading
                                      function and shift the spectrum
                                      to the restframe.
  catpath  = $MIRCAT/jplcat  or /home/miriad/miriad_cvs/cat/jplcat
                                    % the location of the catalog
                                      directory.
  vsource   = 61                    % systematic velocity
  veltype   = lsr                   % the reference frame
  veldef   = radio                  % velocity definition
  axis     = freq,both              % plot frequency vs both amplitude
                                      and phase
  yrange   =
  device   = /xs                    % display device.
  nxy      = 1,1                    % 1 plot per page.
  log      =
After setup, then type go and the program will ask
users to select molecules
from the screen by going through all the molecular name tags
supported in the JPL catalog. Here is an example to select
![]() for the spectral line identifications:
for the spectral line identifications:
select   1001    H-atom        (<type> y to select it or n to skip it or t to terminate)
n
skip
select   2001    D-atom        (<type> y to select it or n to skip it or t to terminate)
n
skip
select   3001    HD            (<type> y to select it or n to skip it or t to terminate)
n
skip
select   4001    H2D+          (<type> y to select it or n to skip it or t to terminate)
n
skip
select   7001    Li-6-H        (<type> y to select it or n to skip it or t to terminate)
...
select  30002    HC-13-O+      (<type> y to select it or n to skip it or t to terminate)
n
skip
select  30003    DCO+          (<type> y to select it or n to skip it or t to terminate)
n
skip
select  30004    H2CO          (<type> y to select it or n to skip it or t to terminate)
y
yes
select  30005    C-13-H2NH     (<type> y to select it or n to skip it or t to terminate)
t
terminate selection
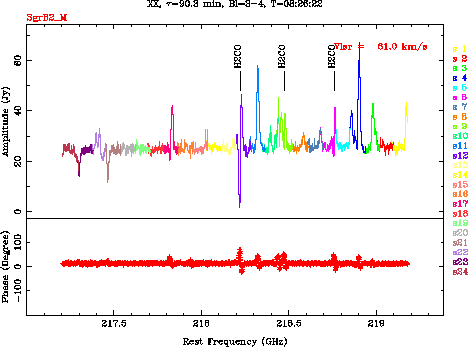
Then, the relevant ![]() transitions in the frequency range
will be lablled at the rest frequencies along with the spectrum
plotted in a display device (Fig. 5.1.).
transitions in the frequency range
will be lablled at the rest frequencies along with the spectrum
plotted in a display device (Fig. 5.1.).
 |