Tropospheric Ozone Profiles From Airborne Measurements
![]()
Liu, X., C.E. Sioris, K.V. Chance, T.P. Kurosu, M.J. Newchurch, R.V. Martin, P.I. Palmer, Mapping tropospheric ozone profiles from an airborne UV/Visible spectrometer, App. Opt., 44(16), 3312-3319, 2005. [Full text (pdf)]
Because of the sparse distribution of in-situ observations and the large spatial and temporal variability of tropospheric O3, remote sensing techniques are crucial for studying its distributions, photochemical sources and sinks, transport, and seasonal behavior.
Global distribution of tropospheric ozone has been directly retrieved from Global Ozone Monitoring Experiment (GOME) in the Ultraviolet. However, the spatial resolution is very coarse: 960 km x 80 km. This method can be similarly applied to OMI measurements, but the spatial resolution at nadir is still 13 km x 24 km. Intermediate-scale measurements (between in-situ measurements and satellite observations) are lacking. However, the lifetimes of tropospheric O3 and many of its reactive precursors are long enough that atmospheric transport plays an important role in their atmospheric distribution. It is therefore difficult to relate the in-situ observations to larger spatial scales and to validate area satellite measurements against point in-situ measurements. Spectroscopic remote sensing from aircraft offers a unique capability to measure gases on intermediate spatial scales, thereby filling the gap between in-situ measurements and space-borne observations.
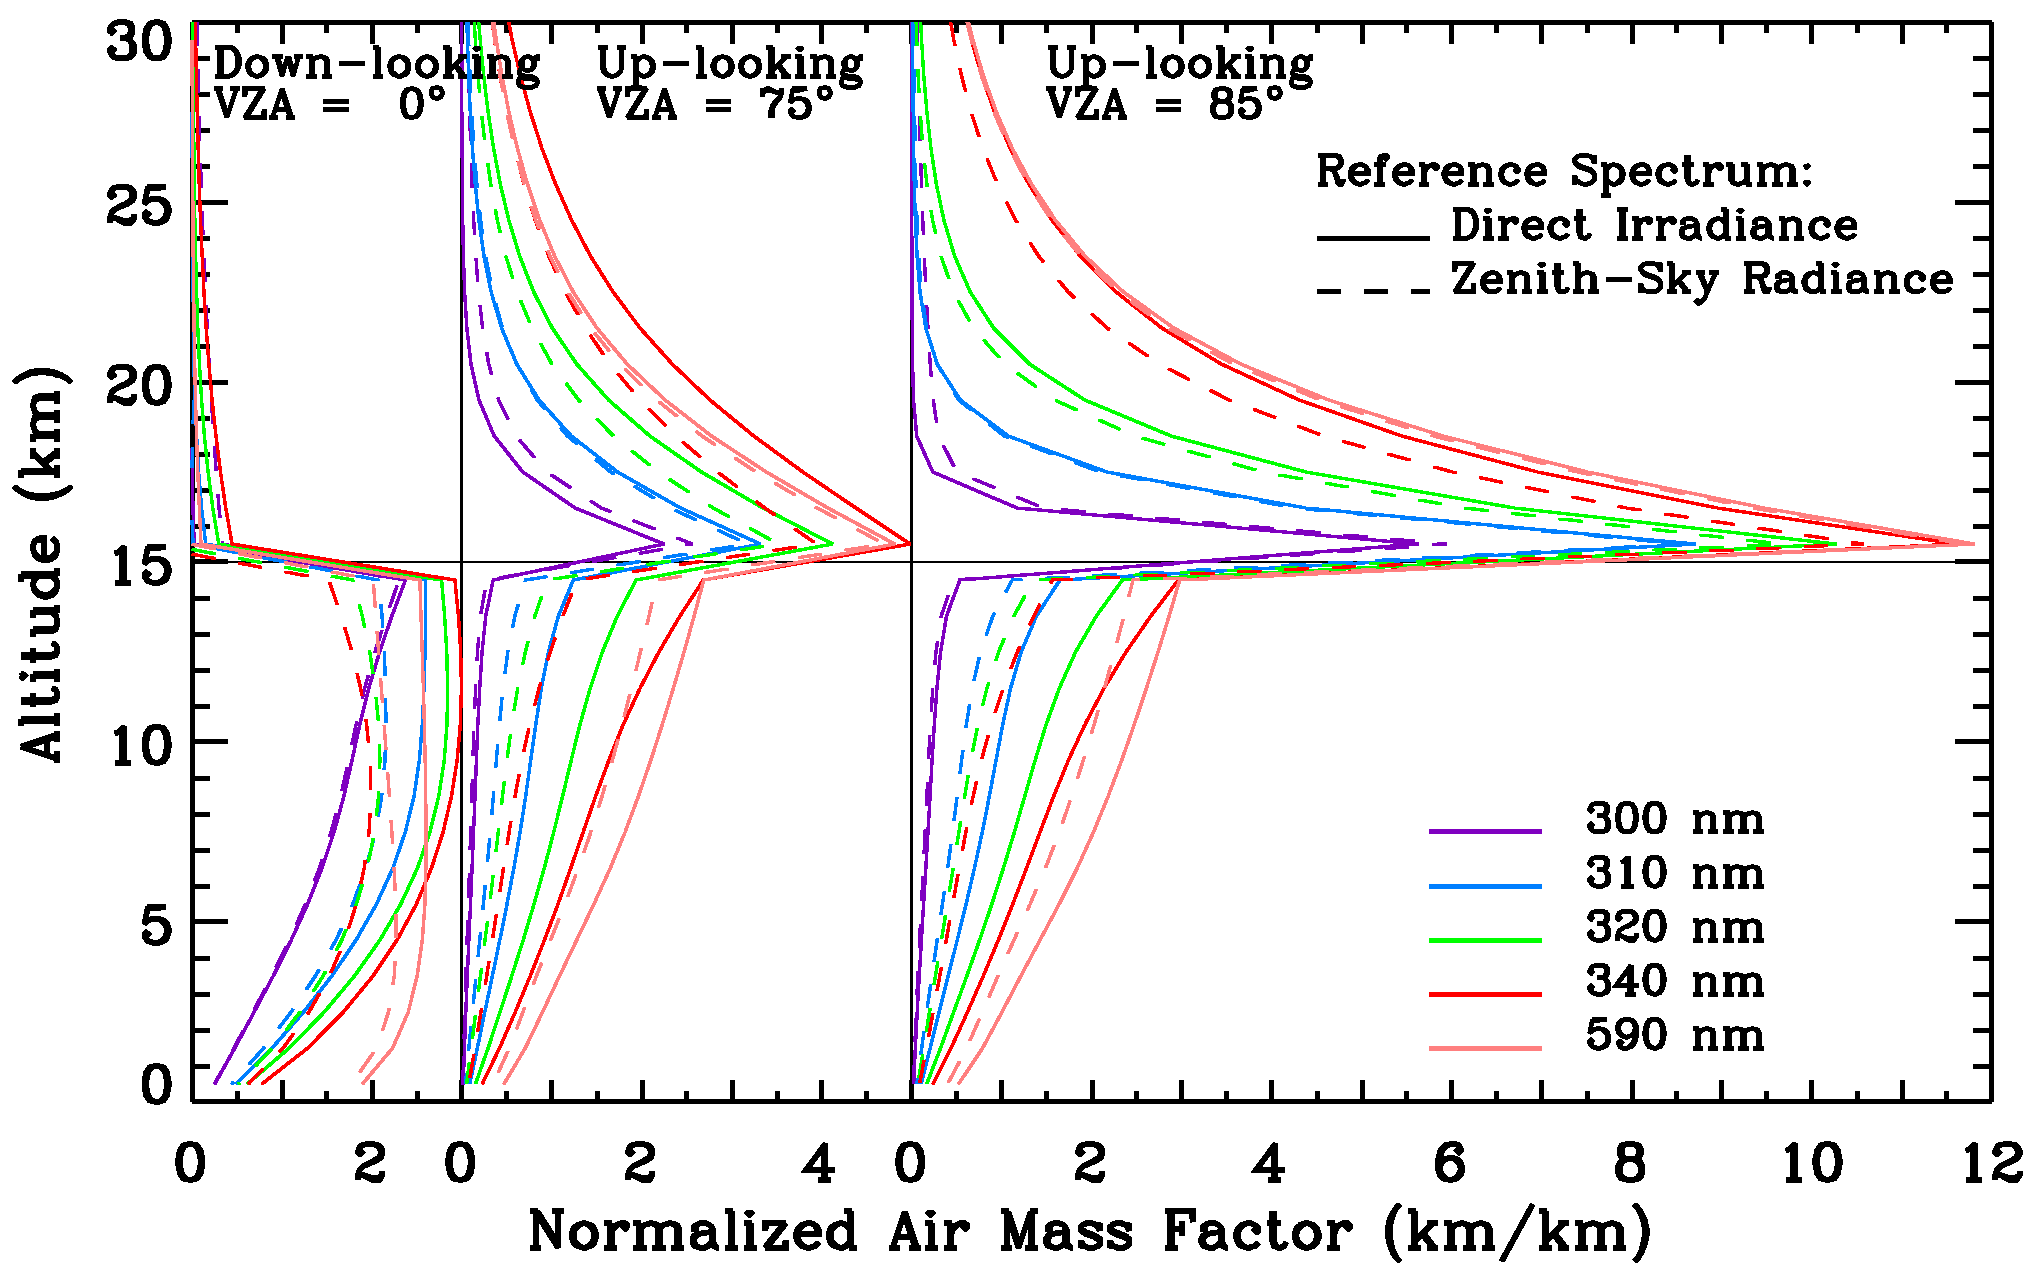
We present a novel technique to retrieve O3 profiles and, especially, tropospheric O3 from airborne UV/Visible spectrometer measurements. This technique utilizes radiance spectra from one down-looking and two up-looking (85 and 75) directions, taking advantage of O3 absorption structure in the Huggins (300-340 nm) and the Chappuis bands (530-650 nm) (Figure 1).
|
|
|
Figure 1. Air mass factors (km/km) for normalized radiances at 300, 310, 320, 340, and 590 nm for down-looking with a VZA of 0º, and up-looking with VZAs of 75º and 85º, respectively. The solid lines use the direct irradiance as a normalization reference and the dashed lines use the zenith-sky radiance as a reference. The US standard atmosphere with a total O3 of 345.0 DU and LOWTRAN background aerosols is used. The SZA is 45º and surface albedo is 0.1. Flight altitude is 15.0 km. |
The radiance spectra are normalized to direct-sun spectra or zenith-sky spectra, so no external solar reference spectrum is needed. This technique is especially sensitive to tropospheric O3 below and < 8 km above the aircraft with a vertical resolution of 2-6 km and is sensitive to lower and middle stratospheric O3, with a vertical resolution of 8-15 km (Figure 2).
|
|
|
Figure 2. Averaging kernels for the standard case. The three numbers following the symbols show the altitude of the averaging kernel, its nominal peak altitude, and the vertical resolution defined here as full width at half minimum. The black horizontal line shows the flight altitude. |
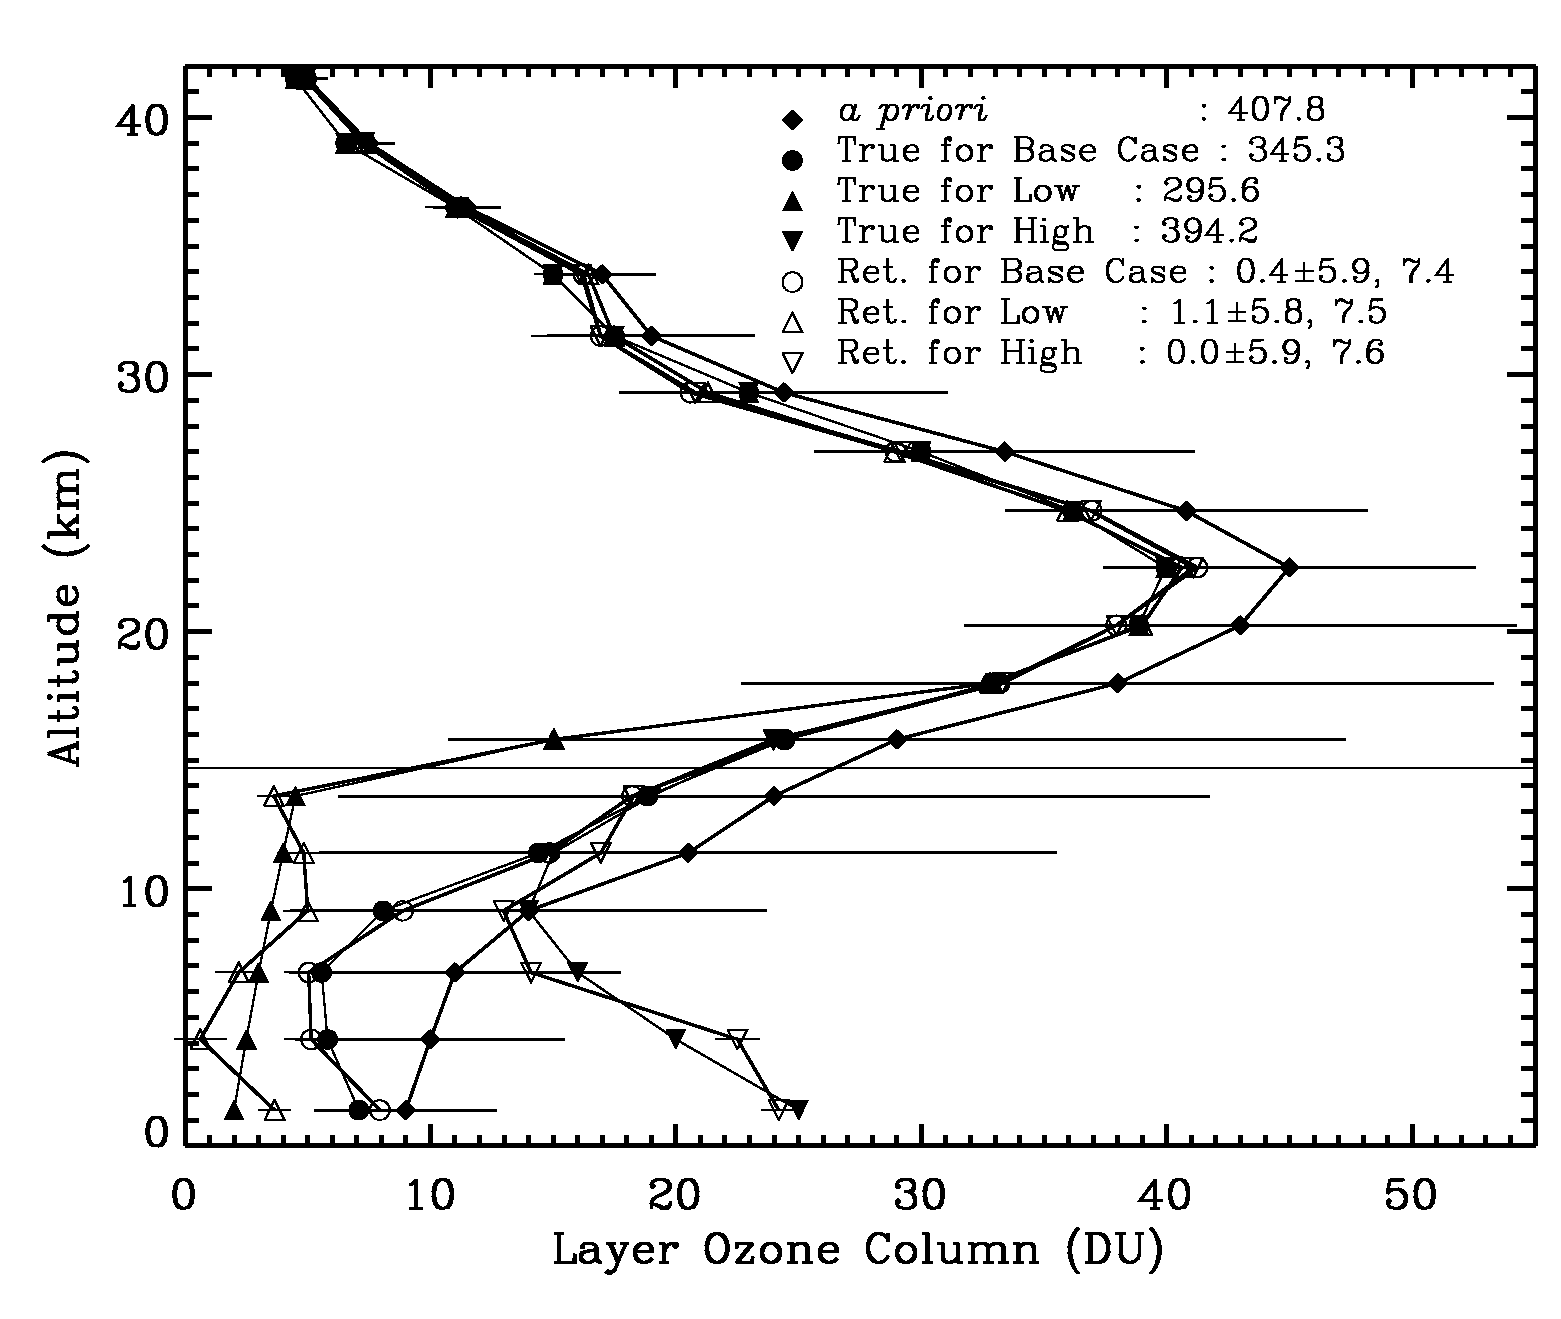
This technique does not require high spectra resolution. It can accurately measure tropospheric O3 for highly-polluted regions as well as remote regions (Figure 3). Assuming a flight altitude of 15 km and a flight speed of 700 km/h, the spatial resolution is ~2 km x 2 km at nadir for down-looking measurements . If the instrument scans to an off axis angle of 79.8º, the swath across the flight direction is ~166.0 km. This high spatial resolution and superior spatial coverage make this technique well suited for satellite validation and regional air quality monitoring.
|
|
|
Figure 3. True and retrieved O3 profiles for the base case, and for two modified cases having low and high tropospheric O3 conditions, respectively. The actual total O3 is indicated as "true" and the total O3 bias and DFS are indicated for the retrievals. The solid diamonds show the a priori profile and corresponding standard deviations (i.e., as error bars). The error bars on retrievals include both random-noise errors and smoothing errors. |
![]()
Last updated on 04/04/2006 .