Hydra-7@ADC Status
|
Hydra has been moved to the new data center, updates are at the
Data Center Move page. You can view the list of all the available modules: as an HTML document, or a plain ASCII text file. You can also check the bandwidth between SAO and HDC. You can select to have this page refreshed every 5m, 20m, or 1hr, this one will auto-refresh every 20m. |
-
Usage

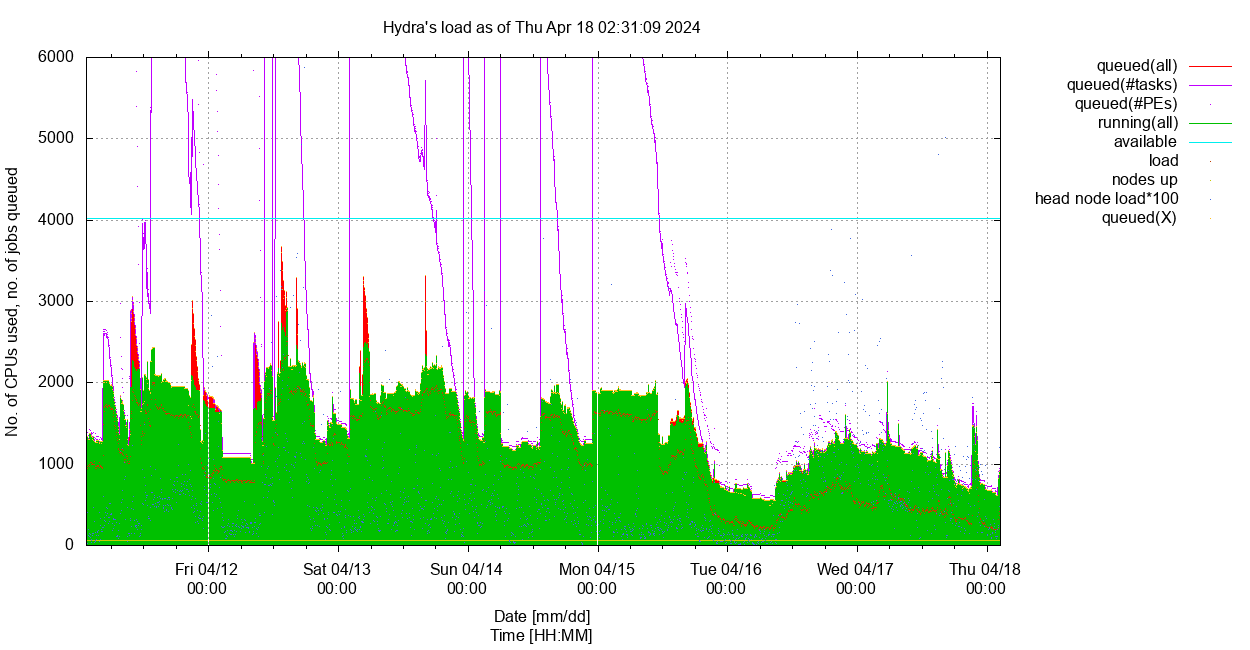
Current snapshot sorted by nodes' . Usage vs time, for length= and user= highlighted.
As of Wed May 27 08:27:03 2026: #CPUs/nodes 5612/74, 0 down.
Loads: head node: 0.31, login nodes: 0.00, 0.20, 0.00, 0.56; NSDs: 0.13, 0.49, 0.08, 2.78, 2.80; licenses: none used.
Queues status: none disabled, none need attention, none in error state.
23 users with running jobs (slots/jobs):
Current load: 538.4, #running (slots/jobs): 738/42, usage: 13.2%, efficiency: 73.0%
3 users with queued jobs (jobs/tasks/slots):
figueiroh=3/53/131 kathiresang=1/1/4 whiteae=5/17/68 Total number of queued jobs/tasks/slots: 9/71/203
64 users have/had running or queued jobs over the past 7 days, 85 over the past 15 days. 107 over the past 30 days.
Click on the tabs to view each section, on the plots to view larger versions.
You can view the current cluster snapshot sorted by name, no. cpu, usage, load or memory, and
view the past load for 7, or 15, or 30 days as well as highlight a given user by selecting the corresponding options in the drop down menus.{}
This page was last updated on Wednesday, 27-May-2026 08:32:38 EDT with mk-webpage.pl ver. 7.3/1 (Oct 2025/SGK) in 0:59. -
Warnings
Oversubscribed Jobs
As of Wed May 27 08:27:04 EDT 2026 (7 oversubscribed jobs, showing no more than 3 per user)

Total running (PEs/jobs) = 738/42, 9 queued (jobs), showing only oversubscribed jobs (cpu% > 133% & age > 1h) for all users.
     jobID name            user                age nPEs      cpu% queue     node taskID
  14375765 beast2_tree     uribeje           +4:18    8    385.6% uThM.q   65-23
  14375766 beast2_tree     uribeje           +4:17    8    358.4% uThM.q   65-13
  14375767 beast2_tree     uribeje           +4:17    8    384.1% uThM.q   65-02
  14381137 hapcaller       figueiroh         +1:13    1    156.6% mThM.q   75-07     41
  14385504 qsub_Tapeworms_ phillipsaj        17:25    1    188.8% mThC.q   93-01
  14385537 qsub_Tapeworms_ phillipsaj        17:14    1    169.3% mThC.q   75-01
  14389645 tr_conus_v2     taom              06:59    4   1110.5% mTgpu.q  50-01

⇒ Equivalent to 108.8 overused CPUs: 31 CPUs used at 451.0% on average.
Inefficient Jobs
As of Wed May 27 08:27:04 EDT 2026 (8 inefficient jobs, showing no more than 3 per user)

Total running (PEs/jobs) = 738/42, 9 queued (jobs), showing only inefficient jobs (cpu% < 33% & age > 1h) for all users.
     jobID name            user                age nPEs      cpu% queue     node taskID
  14367884 iqtree.50p.oct2 cerqueirat        +5:16   12     21.7% lThM.q   76-10
  14374824 test            campanam          +4:22    1      0.4% lTWFM.sq 64-16
  14374934 vitis_ssp_cactu niez              +4:20  110     30.4% mThC.q   76-04
  14375143 mitobim_loop.jo wirshingh         +4:19    6     16.7% mThC.q   64-04
  14378641 bwa_SeqWell     zhangy            +2:13   24     16.4% lThC.q   76-07
  14381209 gzip            bourkeb           +1:02    8     12.3% mThM.q   93-04
  14382931 bears           atkinsonga        21:00    1      0.2% lTWFM.sq 64-15
  14389656 earthaccess_ges ggonzale          04:27    1      6.3% lTIO.sq  64-16

⇒ Equivalent to 121.0 underused CPUs: 163 CPUs used at 25.8% on average.
Nodes with Excess Load
As of Wed May 27 08:27:05 EDT 2026 (5 nodes have a high load, offset=1.5)

                #slots        excess
    node  #CPUs   used   load   load
 -----------------------------------
   50-01     64     16   53.8   37.8 *
   65-02     64      8   27.4   19.4 *
   65-13     64      8   28.2   20.2 *
   65-17     64      0   20.5   20.5 *
   65-23     64      8   34.7   26.7 *

         Total excess load = 124.6
High Memory Jobs
Statistics
  User                     nSlots       memory        memory         vmem     maxvmem   ratio
  Name                      used        reserved      used           used     used [TB] resd/maxvm
--------------------------------------------------------------------------------------------------
  uribeje                 84  48.6%  2.1328  55.7%   0.5723  87.2%   0.6174   0.7248       2.9
  zhangy                  28  16.2%  0.4375  11.4%   0.0111   1.7%   0.1601   0.4564       1.0
  nevesk                  20  11.6%  0.3906  10.2%   0.0009   0.1%   0.1658   0.1661       2.4
  cabreroa                10   5.8%  0.2930   7.7%   0.0397   6.1%   0.0177   0.0673       4.4
  bourkeb                  8   4.6%  0.2500   6.5%   0.0000   0.0%   0.0000   0.0000    10913.6
  jhora                   10   5.8%  0.2500   6.5%   0.0021   0.3%   0.0190   0.0207      12.1
  cerqueirat              12   6.9%  0.0586   1.5%   0.0257   3.9%   0.0260   0.0260       2.3
  figueiroh                1   0.6%  0.0156   0.4%   0.0044   0.7%   0.0046   0.0047       3.3
==================================================================================================
  Total                  173         3.8281          0.6563          1.0107   1.4661       2.6
Warnings
13 high memory jobs produced a warning:
    1 for bourkeb
    1 for cabreroa
    1 for cerqueirat
    1 for figueiroh
    1 for nevesk
    6 for uribeje
    2 for zhangy
Details for each job can be found here.
-
Breakdown by Queue

Select length:
Current Usage by Queue
Total Limit Fill factor Efficiency sThC.q=0 mThC.q=237 lThC.q=306 uThC.q=0 543 5056 10.7% 89.2% sThM.q=10 mThM.q=9 lThM.q=130 uThM.q=24 173 4680 3.7% 260.4% sTgpu.q=0 mTgpu.q=16 lTgpu.q=0 qgpu.iq=0 16 104 15.4% 337.9% uTxlM.rq=0 0 536 0.0% lThMuVM.tq=0 0 384 0.0% lTb2g.q=0 0 2 0.0% lTIO.sq=1 1 8 12.5% 0.6% lTWFM.sq=2 2 4 50.0% 0.1% qrsh.iq=3 3 68 4.4% 1.7% Total: 738
-
Avail Slots/Wait Job(s)
Available Slots
As of Wed May 27 08:27:04 EDT 2026

4596 avail(slots), free(load)=5305.2, unresd(mem)=36778.3G, for hgrp=@hicpu-hosts and minMem=1.0G/slot
  total(nCPU)      5312 total(mem)   41.3T
  unused(slots)    4596 unused(load) 5305.2  ie:  86.5%  99.9%
  unreserved(mem) 35.9T unused(mem)  39.9T  ie:  87.0%  96.6%
  unreserved(mem)  8.0G unused(mem)   8.9G per unused(slots)

4166 avail(slots), free(load)=4826.3, unresd(mem)=36349.1G, for hgrp=@himem-hosts and minMem=1.0G/slot
  total(nCPU)      4832 total(mem)   40.7T
  unused(slots)    4166 unused(load) 4826.3  ie:  86.2%  99.9%
  unreserved(mem) 35.5T unused(mem)  39.5T  ie:  87.2%  97.0%
  unreserved(mem)  8.7G unused(mem)   9.7G per unused(slots)

536 avail(slots), free(load)=536.0, unresd(mem)=8063.0G, for hgrp=@xlmem-hosts and minMem=1.0G/slot
  total(nCPU)       536 total(mem)    7.9T
  unused(slots)     536 unused(load) 536.0  ie: 100.0% 100.0%
  unreserved(mem)  7.9T unused(mem)   7.8T  ie: 100.0%  99.4%
  unreserved(mem) 15.0G unused(mem)  14.9G per unused(slots)

88 avail(slots), free(load)=103.2, unresd(mem)=746.2G, for hgrp=@gpu-hosts and minMem=1.0G/slot
  total(nCPU)       104 total(mem)    0.7T
  unused(slots)      88 unused(load) 103.2  ie:  84.6%  99.2%
  unreserved(mem)  0.7T unused(mem)   0.4T  ie:  98.9%  48.7%
  unreserved(mem)  8.5G unused(mem)   4.2G per unused(slots)
GPU Usage
Wed May 27 08:27:10 EDT 2026
hostgroup: @gpu-hosts (3 hosts)
                - --- memory (GB) ----  -  #GPU - --------- slots/CPUs ---------
hostname        -   total   used   resd -  a/u  - nCPU used   load - free unused
compute-50-01   -   503.3  358.0  145.3 -  4/4  -   64   16   53.8 -   48   10.2
compute-79-01   -   125.5   18.1  107.4 -  2/0  -   20    0    0.1 -   20   19.9
compute-79-02   -   125.5   10.5  115.0 -  2/0  -   20    0    0.1 -   20   19.9

Total GPU=8, used=4 (50.0%)
Waiting Job(s)
As of Wed May 27 08:27:05 EDT 2026

3 jobs waiting for figueiroh:

 jobID     jobName         user              age   nPEs  memReqd queue  taskID
 --------- --------------- ---------------- ------ ---- -------- ------ -------
  14381138 make_sample_map figueiroh         +1:13    1      1.0 sThC.q
  14381139 genomicsdb      figueiroh         +1:13    4     32.0 mThC.q   1-26:1
  14381140 genotype_gvcfs  figueiroh         +1:13    1     16.0 mThM.q   1-26:1

 quota rule           resource=value/limit             %used
 -------------------  -------------------------------  ------
 max_mem_res_per_user/2    mem_res=16.00G/8.944T              0.2% for figueiroh in queue uThM.q
 max_hM_slots_per_user/2   slots=1/585                        0.2% for figueiroh in queue mThM.q
 max_slots_per_user/1      slots=1/840                        0.1% for figueiroh
 -------------------  -------------------------------  ------

1 job waiting for kathiresang:

 jobID     jobName         user              age   nPEs  memReqd queue  taskID
 --------- --------------- ---------------- ------ ---- -------- ------ -------
  14389647 mmrag_ingest_fu kathiresang       09:38    4          sTgpu.q

 none running.

5 jobs waiting for whiteae:

 jobID     jobName         user              age   nPEs  memReqd queue  taskID
 --------- --------------- ---------------- ------ ---- -------- ------ -------
  14389514 chandra_vllm    whiteae           10:57    4                        4
  14389515 chandra_vllm    whiteae           10:57    4                    1-4:1
  14389516 chandra_vllm    whiteae           10:57    4                    1-4:1
  14389517 chandra_vllm    whiteae           10:57    4                    1-4:1
  14389519 chandra_vllm    whiteae           10:57    4                    1-4:1

 quota rule           resource=value/limit             %used
 -------------------  -------------------------------  ------
 max_gpus_per_user/2       GPUS=3/3                         100.0% for whiteae in queue mTgpu.q
 total_gpus_per_user/1     GPUS=3/4                          75.0% for whiteae in queue qgpu.iq
 max_slots_per_user/1      slots=12/840                       1.4% for whiteae
 -------------------  -------------------------------  ------
Overall Quota Usage
 quota rule           resource=value/limit             %used
 -------------------  -------------------------------  ------
 total_gpus/1              GPUS=4/8                          50.0% for * in queue mTgpu.q
 total_slots/1             slots=739/5960                    12.4% for *
 total_mem_res/2           mem_res=3.828T/35.78T             10.7% for * in queue uThM.q
 total_mem_res/1           mem_res=1.555T/39.94T              3.9% for * in queue uThC.q
-
Memory Usage
Reserved Memory, All High-Memory Queues

Select length:
Current Memory Quota Usage
As of Wed May 27 08:27:05 EDT 2026

quota rule                resource=value/limit              %used filter
---------------------------------------------------------------------------------------------------
total_mem_res/1           mem_res=1.555T/39.94T              3.9% for * in queue uThC.q
total_mem_res/2           mem_res=3.828T/35.78T             10.7% for * in queue uThM.q
Current Memory Usage by Compute Node, High Memory Nodes Only
hostgroup: @himem-hosts (56 hosts)
                - ----------- memory (GB) ------------  - --------- slots/CPUs ---------
hostname        -   avail   used   resd - unused unresd - nCPU used   load - free unused
compute-64-17   -   503.5   10.8    0.2 -  492.7  503.3 -   32    0    0.0 -   32   32.0
compute-64-18   -   503.5   28.2  300.2 -  475.3  203.3 -   32   10    9.6 -   22   22.4
compute-65-02   -   503.5   21.2  128.0 -  482.3  375.5 -   64    8   28.1 -   56   35.9
compute-65-03   -   503.5   11.7   64.0 -  491.8  439.5 -   64   16   16.1 -   48   48.0
compute-65-04   -   503.5   11.1    6.0 -  492.4  497.5 -   64    1    1.2 -   63   62.8
compute-65-05   -   503.5   11.1    0.0 -  492.4  503.5 -   64    0    0.0 -   64   64.0
compute-65-06   -   503.5   11.1    0.0 -  492.4  503.5 -   64    0    0.0 -   64   64.0
compute-65-07   -   503.5   11.1    0.0 -  492.4  503.5 -   64    0    0.0 -   64   64.0
compute-65-09   -   503.5   11.5    0.0 -  492.0  503.5 -   64    0    0.0 -   64   64.0
compute-65-10   -   503.5   11.0    0.0 -  492.5  503.5 -   64    0    0.1 -   64   64.0
compute-65-11   -   503.5   11.2    0.0 -  492.3  503.5 -   64    0    0.0 -   64   64.0
compute-65-12   -   503.5   11.1    0.0 -  492.4  503.5 -   64    0    0.0 -   64   64.0
compute-65-13   -   503.5   21.1  128.0 -  482.4  375.5 -   64    8   28.2 -   56   35.8
compute-65-14   -   503.5   14.2    0.0 -  489.3  503.5 -   64   60   60.1 -    4    3.9
compute-65-15   -   503.5   11.1    0.0 -  492.4  503.5 -   64    0    0.0 -   64   64.0
compute-65-16   -   503.5   18.8   64.0 -  484.7  439.5 -   64    8    6.9 -   56   57.1
compute-65-17   -   503.5   11.1    0.0 -  492.4  503.5 -   64    0   20.5 -   64   43.5
compute-65-18   -   503.5   14.6    0.0 -  488.9  503.5 -   64   61   61.0 -    3    3.0
compute-65-19   -   503.5   11.1    0.0 -  492.4  503.5 -   64    0    0.0 -   64   64.0
compute-65-20   -   503.5   14.2    4.0 -  489.3  499.5 -   64    1    1.1 -   63   63.0
compute-65-21   -   503.5   11.1    0.0 -  492.4  503.5 -   64    0    0.0 -   64   64.0
compute-65-22   -   503.5   11.0    0.0 -  492.5  503.5 -   64    0    0.0 -   64   64.0
compute-65-23   -   503.5   21.4  128.0 -  482.1  375.5 -   64    8   34.7 -   56   29.3
compute-65-24   -   503.5   11.1    0.0 -  492.4  503.5 -   64    0    0.1 -   64   63.9
compute-65-25   -   503.5   11.0    0.0 -  492.5  503.5 -   64    0    0.0 -   64   64.0
compute-65-26   -   503.5   11.4    0.0 -  492.1  503.5 -   64    0    0.1 -   64   64.0
compute-65-27   -   503.5   11.3    0.0 -  492.2  503.5 -   64    0    0.0 -   64   64.0
compute-65-28   -   503.5   11.0    0.0 -  492.5  503.5 -   64    0    0.0 -   64   64.0
compute-65-29   -   503.5   11.0    0.0 -  492.5  503.5 -   64    0    0.0 -   64   64.0
compute-65-30   -   503.5   11.0    0.0 -  492.5  503.5 -   64    0    0.3 -   64   63.7
compute-75-01   -  1007.5   13.1    8.1 -  994.4  999.4 -  128    1    1.7 -  127  126.3
compute-75-02   -  1007.5   12.5    0.0 -  995.0 1007.5 -  128    0    0.1 -  128  127.9
compute-75-03   -   755.5   12.3    2.0 -  743.2  753.5 -  128  122    0.1 -    6  127.9
compute-75-04   -   755.5   75.0  400.0 -  680.5  355.5 -  128   20   20.1 -  108  108.0
compute-75-05   -   755.5   19.8  256.0 -  735.7  499.5 -  128   10    7.8 -  118  120.2
compute-75-06   -   755.5   19.6   64.0 -  735.9  691.5 -  128    8    6.5 -  120  121.5
compute-75-07   -   755.5   14.7  208.0 -  740.8  547.5 -  128   13    5.0 -  115  123.0
compute-76-03   -  1007.4   20.4   64.5 -  987.0  942.9 -  128    8    6.2 -  120  121.8
compute-76-04   -  1007.4   14.6  800.0 -  992.8  207.4 -  128  110   44.0 -   18   84.0
compute-76-05   -  1007.4   13.2    0.0 -  994.2 1007.4 -  128    0    0.0 -  128  128.0
compute-76-06   -  1007.4   34.9  256.0 -  972.5  751.4 -  128   16    8.0 -  112  120.0
compute-76-07   -  1007.4  117.7  792.0 -  889.7  215.4 -  128   44    6.4 -   84  121.6
compute-76-08   -  1007.4   13.2    0.0 -  994.2 1007.4 -  128    0    0.0 -  128  128.0
compute-76-09   -  1007.4   12.9    0.0 -  994.5 1007.4 -  128    0    0.0 -  128  128.0
compute-76-10   -  1007.4   40.0   60.0 -  967.4  947.4 -  128   19    9.4 -  109  118.6
compute-76-11   -  1007.4   96.1  132.0 -  911.3  875.4 -  128   65   45.2 -   63   82.8
compute-76-12   -  1007.4  129.6  600.0 -  877.8  407.4 -  128   20    1.6 -  108  126.4
compute-76-13   -  1007.4   96.9  600.0 -  910.5  407.4 -  128   20   15.7 -  108  112.3
compute-76-14   -  1007.4   13.3    0.0 -  994.1 1007.4 -  128    0    0.0 -  128  128.0
compute-84-01   -   881.1   13.1    0.0 -  868.0  881.1 -  112    0    0.1 -  112  112.0
compute-93-01   -   503.8   11.2    8.0 -  492.6  495.8 -   64    1    2.0 -   63   62.0
compute-93-02   -   755.6   11.5    0.0 -  744.1  755.6 -   72    0    0.1 -   72   71.9
compute-93-03   -   755.6   11.6    0.0 -  744.0  755.6 -   72    0    0.1 -   72   71.9
compute-93-04   -   755.6   11.6  256.0 -  744.0  499.6 -   72    8    1.0 -   64   71.0
compute-93-05   -  2016.3   11.7    0.0 - 2004.6 2016.3 -   96    0    0.0 -   96   96.0
compute-93-06   -  3023.9   11.8    0.0 - 3012.1 3023.9 -   56    0    0.0 -   56   56.0
                   ======= ===== ======                   ==== ====  =====
Totals             41678.2 1250.9 5329.1                   4832  666  449.1
                       ==>   3.0%  12.8%                  ==>  13.8%   9.3%
Most unreserved/unused memory (3023.9/3012.1GB) is on compute-93-06 with 56/56.0 slots/CPUs free/unused.

hostgroup: @xlmem-hosts (4 hosts)
                - ----------- memory (GB) ------------  - --------- slots/CPUs ---------
hostname        -   avail   used   resd - unused unresd - nCPU used   load - free unused
compute-76-01   -  1511.4   13.0   -0.0 - 1498.4 1511.4 -  192    0    0.0 -  192  192.0
compute-76-02   -  1511.4   14.8   -0.0 - 1496.6 1511.4 -  192    0    0.1 -  192  191.8
compute-93-05   -  2016.3   11.7    0.0 - 2004.6 2016.3 -   96    0    0.0 -   96   96.0
compute-93-06   -  3023.9   11.8    0.0 - 3012.1 3023.9 -   56    0    0.0 -   56   56.0
                   ======= ===== ======                   ==== ====  =====
Totals             8063.0   51.3    0.0                    536    0    0.1
                       ==>   0.6%   0.0%                  ==>   0.0%   0.0%
Most unreserved/unused memory (3023.9/3012.1GB) is on compute-93-06 with 56/56.0 slots/CPUs free/unused.
Past Memory Usage vs Memory Reservation
Past memory use in hi-mem queues between 05/20/26 and 05/27/26
queues: ?ThM.q
                ----------- total ---------  -------------------- mean --------------------
user                 no. of    elapsed time   eff. reserved  maxvmem  average  ratio
name                jobs/slots     [d]        [%]     [GB]     [GB]     [GB]   resd/maxvmem
--------------- -------------- ------------ ----- --------- -------- --------- ------------
cerqueirat             1/12         0.00
whiteae                4/4          0.00     49.9      8.0      0.0      0.0      0.0
quattrinia             2/40         0.00     81.2    480.0     62.8      0.1      7.6 > 2.5
andersonhl             7/56         0.01     12.5     80.0      3.0      2.6     26.8 > 2.5
beckerm                2/16         0.01     34.0     80.0      2.2      2.1     36.3 > 2.5
niez                   6/48         0.02     15.4     31.6      1.3      1.2     24.1 > 2.5
capadorhd              2/8          0.03    203.3     64.0     12.1      0.4      5.3 > 2.5
kistlerl              44/44         0.09     99.6     36.4      6.9      3.4      5.2 > 2.5
peresph                5/60         0.13     99.6     12.0      1.1      1.0     11.3 > 2.5
martinezl2             6/6          0.27     92.3     48.0      3.0      0.6     16.2 > 2.5
jhora                  2/42         0.38     77.7    255.0    340.1      5.2      0.7
sbeaudry              21/30         0.40     51.6     20.1      5.1      4.7      4.0 > 2.5
yisraell              12/480        0.47     72.8   1000.0     36.8     20.3     27.1 > 2.5
pradon                 9/576        0.51     51.8     12.0    191.8    114.1      0.1
szieba                13/542        0.79     25.5      0.0    840.7      5.4      0.0
nevesk                 6/6          1.59     78.8     16.0      0.7      0.2     22.5 > 2.5
palmerem              12/12         1.60   2266.3    120.0     35.4     22.9      3.4 > 2.5
wirshingh              5/45         2.45     40.2     72.0     34.4      3.7      2.1
uribeje               22/228        2.49     34.8    356.9     53.6     28.1      6.7 > 2.5
mancusij               9/15         2.64    163.0     27.7     11.3      1.9      2.5
ramosi                55/131        2.90    104.0      8.0     17.7     11.0      0.5
graujh                 1/64         3.44     37.5    800.0    948.0      6.0      0.8
campanam             127/1523       4.51    108.2     16.7     18.1     10.7      0.9
mghahrem               5/25         4.52     21.7      0.0     17.4     16.6      0.0
bourkeb                6/72         5.12     57.1    358.2    107.5      9.9      3.3 > 2.5
zhangy                 7/88        19.69     54.9    196.0    185.8      1.5      1.1
girardmg            4128/9702      31.45     24.4     66.4     17.8      3.0      3.7 > 2.5
sylvain              316/316       32.46     99.6     66.4     80.4     75.2      0.8
macguigand          5804/18679     36.79     27.1     73.3     15.4      2.1      4.8 > 2.5
figueiroh            852/4128      59.05     61.2     82.7      3.6      2.5     22.8 > 2.5
willishr             205/214      253.86     99.8     11.0      2.2      0.6      5.0 > 2.5
--------------- -------------- ------------ ----- --------- -------- --------- ------------
all                11696/37212    467.66     87.4     53.7     28.7      7.2      1.9
---
queues: ?TxlM.rq
                ----------- total ---------  -------------------- mean --------------------
user                 no. of    elapsed time   eff. reserved  maxvmem  average  ratio
name                jobs/slots     [d]        [%]     [GB]     [GB]     [GB]   resd/maxvmem
--------------- -------------- ------------ ----- --------- -------- --------- ------------
--------------- -------------- ------------ ----- --------- -------- --------- ------------
all                    0/0          0.00
-
Resource Limits
    Limit the number of concurrent jobs per user for some queues
    users {*} queues {uTxlM.rq} to no_concurrent_jobs=3
    users {*} queues {lTIO.sq} to no_concurrent_jobs=2
    users {*} queues {lTWFM.sq} to no_concurrent_jobs=1
    users {*} queues {qrsh.iq} to no_concurrent_jobs=4
    users {*} queues {qgpu.iq} to no_concurrent_jobs=1

    Limit slots for all users together
    users * to slots=5960
    users * queues sThC.q,lThC.q,mThC.q,uThC.q to slots=5176
    users * queues sThM.q,mThM.q,lThM.q,uThM.q to slots=4680
    users * queues uTxlM.rq to slots=536
    users * queues sTgpu.q,mTgpu.q,lTgpu.q to slots=104

    Limit total reserved memory for all users per queue type
    users * queues sThC.q,mThC.q,lThC.q,uThC.q to mem_res=40902G
    users * queues sThM.q,mThM.q,lThM.q,uThM.q to mem_res=36637G
    users * queues uTxlM.rq to mem_res=8063G

    Limit slots/user for all queues
    users {*} to slots=840

    Limit slots/user for hiMem queues
    users {*} queues {sThM.q} to slots=840
    users {*} queues {mThM.q} to slots=585
    users {*} queues {lThM.q} to slots=390
    users {*} queues {uThM.q} to slots=73

    Limit slots/user for xlMem restricted queue
    users {*} queues {uTxlM.rq} to slots=536

    Limit slots/user for interactive (qrsh) queues
    users {*} queues {qrsh.iq} to slots=16

    Limit reserved memory per user for specific queues
    users {*} queues sThC.q,mThC.q,lThC.q,uThC.q to mem_res=10225G
    users {*} queues sThM.q,mThM.q,lThM.q,uThM.q to mem_res=9159G
    users {*} queues uTxlM.rq to mem_res=8063G

    Limit GPUs for all users in GPU queues to the avail no of GPUs
    users * queues {sTgpu.q,mTgpu.q,lTgpu.q,qgpu.iq} to GPUS=8

    Limit to set aside a slot for blast2GO
    users * queues !lTb2g.q hosts {@b2g-hosts} to slots=110
    users * queues lTb2g.q hosts {@b2g-hosts} to slots=1
    users {*} queues lTb2g.q hosts {@b2g-hosts} to slots=1

    Limit GPUs per user in all the GPU queues
    users {*} queues sTgpu.q,mTgpu.q,lTgpu.q,qgpu.iq to GPUS=4

    Limit GPUs per user in each GPU queues
    users {*} queues {sTgpu.q} to GPUS=4
    users {*} queues {mTgpu.q} to GPUS=3
    users {*} queues {lTgpu.q} to GPUS=2
    users {*} queues {qgpu.iq} to GPUS=1

    Limit total number of idl licenses per user
    users {*} to idlrt_license=102

    Limit slots for io queue per user
    users {*} queues {lTIO.sq} to slots=8

    Limit slots for io queue per user
    users {*} queues {lTWFM.sq} to slots=2

    Limit slots/user in hiCPU queues
    users {*} queues {sThC.q} to slots=840
    users {*} queues {mThC.q} to slots=640
    users {*} queues {lThC.q} to slots=431
    users {*} queues {uThC.q} to slots=143
-
Disk Usage & Quota
As of Wed May 27 05:06:02 EDT 2026
Disk Usage
Filesystem                              Size     Used    Avail Capacity  Mounted on

netapp-fas83:/vol_home                  22.36T   19.76T    2.60T  89%/13%  /home
netapp-fas83-n01:/vol_data_public      332.50T  118.76T  213.74T  36%/2%   /data/public
gpfs02:public                          800.00T  574.14T  225.86T  72%/35%  /scratch/public
gpfs02:nmnh_bradys                      25.00T   19.83T    5.17T  80%/59%  /scratch/bradys
gpfs02:nmnh_kistlerl                   120.00T   88.86T   31.14T  75%/14%  /scratch/kistlerl
gpfs02:nmnh_meyerc                      25.00T   21.16T    3.84T  85%/8%   /scratch/meyerc
gpfs02:nmnh_corals                      60.00T   56.97T    3.03T  95%/24%  /scratch/nmnh_corals
gpfs02:nmnh_ggi                        130.00T   36.46T   93.54T  29%/15%  /scratch/nmnh_ggi
gpfs02:nmnh_lab                         25.00T   11.45T   13.55T  46%/12%  /scratch/nmnh_lab
gpfs02:nmnh_mammals                     35.00T   28.90T    6.10T  83%/39%  /scratch/nmnh_mammals
gpfs02:nmnh_mdbc                        60.00T   49.53T   10.47T  83%/26%  /scratch/nmnh_mdbc
gpfs02:nmnh_ocean_dna                   90.00T   65.59T   24.41T  73%/4%   /scratch/nmnh_ocean_dna
gpfs02:nzp_ccg                         145.00T   24.37T  120.63T  17%/12%  /scratch/nzp_ccg
gpfs01:ocio_dpo                         10.00T    6.30T    3.70T  64%/1%   /scratch/ocio_dpo
gpfs01:ocio_ids                          5.00T    0.00G    5.00T   0%/1%   /scratch/ocio_ids
gpfs02:pool_kozakk                      12.00T   10.67T    1.33T  89%/2%   /scratch/pool_kozakk
gpfs02:pool_sao_access                  50.00T    4.79T   45.21T  10%/9%   /scratch/pool_sao_access
gpfs02:pool_sao_rtdc                    20.00T  908.33G   19.11T   5%/1%   /scratch/pool_sao_rtdc
gpfs02:sao_atmos                       350.00T  262.46T   87.54T  75%/12%  /scratch/sao_atmos
gpfs02:sao_cga                          25.00T    9.44T   15.56T  38%/28%  /scratch/sao_cga
gpfs02:sao_tess                         50.00T   23.25T   26.75T  47%/70%  /scratch/sao_tess
gpfs02:scbi_gis                        200.00T  141.06T   58.94T  71%/8%   /scratch/scbi_gis
gpfs02:nmnh_schultzt                    35.00T   24.81T   10.19T  71%/75%  /scratch/schultzt
gpfs02:serc_cdelab                      35.00T    8.81T   26.19T  26%/5%   /scratch/serc_cdelab
gpfs02:stri_ap                          25.00T   21.80T    3.20T  88%/2%   /scratch/stri_ap
gpfs01:sao_sylvain                     145.00T   44.64T  100.36T  31%/23%  /scratch/sylvain
gpfs02:usda_sel                         25.00T   21.37T    3.63T  86%/36%  /scratch/usda_sel
gpfs02:wrbu                             50.00T   44.43T    5.57T  89%/14%  /scratch/wrbu
nas1:/mnt/pool/public                  175.00T  107.02T   67.98T  62%/1%   /store/public
nas1:/mnt/pool/nmnh_bradys              40.00T   14.58T   25.42T  37%/1%   /store/bradys
nas2:/mnt/pool/n1p3/nmnh_ggi            90.00T   36.28T   53.72T  41%/1%   /store/nmnh_ggi
nas2:/mnt/pool/nmnh_lab                 40.00T   16.61T   23.39T  42%/1%   /store/nmnh_lab
nas2:/mnt/pool/nmnh_ocean_dna           70.00T   32.22T   37.78T  47%/1%   /store/nmnh_ocean_dna
nas1:/mnt/pool/nzp_ccg                 262.38T  127.30T  135.08T  49%/1%   /store/nzp_ccg
nas2:/mnt/pool/nzp_cec                  40.00T   20.71T   19.29T  52%/1%   /store/nzp_cec
nas2:/mnt/pool/n1p2/ocio_dpo            20.00T   11.97T    8.03T  60%/1%   /store/ocio_dpo
nas2:/mnt/pool/n1p1/sao_atmos          750.00T  443.07T  306.93T  60%/1%   /store/sao_atmos
nas2:/mnt/pool/n1p2/nmnh_schultzt       80.00T   24.96T   55.04T  32%/1%   /store/schultzt
nas1:/mnt/pool/sao_sylvain              50.00T    9.64T   40.36T  20%/1%   /store/sylvain
nas1:/mnt/pool/wrbu                     80.00T   10.02T   69.98T  13%/1%   /store/wrbu
nas1:/mnt/pool/admin                    20.00T    8.05T   11.95T  41%/1%   /store/admin
You can view plots of disk use vs time, for the past 7, 30, or 120 days; as well as plots of disk usage by user, or by device (for the past 90 or 240 days respectively).Notes
Capacity shows % disk space full and % of inodes used.
When too many small files are written on a disk, the file system can become full because it is unable to keep track of new files.
The % of inodes should be lower or comparable to the % of disk space used.
If it is much larger, the disk can become unusable before it gets full.
Disk Quota Report
Volume=NetApp:vol_data_public, mounted as /data/public
                     --  disk   --     --  #files --     default quota:  4.50TB/10.0M
Disk                 usage   %quota    usage  %quota     name, affiliation - username (indiv. quota)
-------------------- ------- ------    ------ ------     -------------------------------------------
/data/public          4.13TB  91.8%     5.07M  50.7%     Alicia Talavera, NMNH - talaveraa

Volume=NetApp:vol_home, mounted as /home
                     --  disk   --     --  #files --     default quota: 384.0GB/10.0M
Disk                 usage   %quota    usage  %quota     name, affiliation - username (indiv. quota)
-------------------- ------- ------    ------ ------     -------------------------------------------
/home                378.6GB  98.6%     0.18M   1.8% *** Paige Byerly, NZP - byerlyp
/home                375.5GB  97.8%     0.09M   0.9% *** Rebeka Tamasi Bottger, SAO/OIR - rbottger
/home                363.6GB  94.7%     0.27M   2.7%     Juan Uribe, NMNH - uribeje
/home                347.4GB  90.5%     2.92M  29.2%     Brian Bourke, WRBU - bourkeb
/home                338.6GB  88.2%     0.27M   2.7%     Paul Cristofari, SAO/SSP - pcristof
/home                329.1GB  85.7%     0.00M   0.0%     Allan Cabrero, NMNH - cabreroa

Volume=GPFS:scratch_public, mounted as /scratch/public
                     --  disk   --     --  #files --     default quota: 15.00TB/39.8M
Disk                 usage   %quota    usage  %quota     name, affiliation - username (indiv. quota)
-------------------- ------- ------    ------ ------     -------------------------------------------
/scratch/public      17.20TB 114.7%     2.78M   7.0% *** Ting Wang, NMNH - wangt2
/scratch/public      14.30TB  95.3%     1.69M   4.2% *** Juan Uribe, NMNH - uribeje
/scratch/public      14.20TB  94.7%     0.30M   0.8%     Allen G. Collins, NMNH - collinsa
/scratch/public      13.70TB  91.3%    21.82M  54.8%     Zelong Nie, NMNH - niez
/scratch/public      13.60TB  90.7%    10.41M  26.1%     Michael Trizna, NMNH/BOL - triznam
/scratch/public      13.50TB  90.0%     2.32M   5.8%     Solomon Chak, SERC - chaks
/scratch/public      13.50TB  90.0%    14.41M  36.2%     Brian Bourke, WRBU - bourkeb
/scratch/public      13.40TB  89.3%     0.69M   1.7%     Joseph Hora, SAO/OIR - jhora
/scratch/public      13.30TB  88.7%    36.25M  91.0%     Alberto Coello Garrido, NMNH - coellogarridoa
/scratch/public      13.20TB  88.0%     4.20M  10.5%     Kevin Mulder, NZP - mulderk

Volume=GPFS:scratch_stri_ap, mounted as /scratch/stri_ap
                     --  disk   --     --  #files --     default quota:  5.00TB/12.6M
Disk                 usage   %quota    usage  %quota     name, affiliation - username (indiv. quota)
-------------------- ------- ------    ------ ------     -------------------------------------------
/scratch/stri_ap     19.60TB 392.0%     0.25M   0.0% *** Carlos Arias, STRI - ariasc

Volume=NAS:store_public, mounted as /store/public
                     --  disk   --     --  #files --     default quota:   0.0MB/0.0M
Disk                 usage   %quota    usage  %quota     name, affiliation - username (indiv. quota)
-------------------- ------- ------    ------ ------     -------------------------------------------
/store/public         4.80TB  96.1%        -      -  *** Madeline Bursell, OCIO - bursellm (5.0TB/0M)
/store/public         4.73TB  94.6%        -      -      Zelong Nie, NMNH - niez (5.0TB/0M)
/store/public         4.51TB  90.1%        -      -      Alicia Talavera, NMNH - talaveraa (5.0TB/0M)
/store/public         4.39TB  87.8%        -      -      Mirian Tsuchiya, NMNH/Botany - tsuchiyam (5.0TB/0M)
SSD Usage
  Node   -------------------------- /ssd -------------------------------
  Name     Size   Used  Avail    Use% |   Resd  Avail  Resd% | Resd/Used
 64-18    3.49T  24.6G  3.47T    0.7% |   0.0G  3.49T   0.0% |   0.00
 65-02    3.49T  65.5G  3.43T    1.8% |   0.0G  3.49T   0.0% |   0.00
 65-03    3.49T  64.5G  3.43T    1.8% |   0.0G  3.49T   0.0% |   0.00
 65-04    3.49T  65.5G  3.43T    1.8% |   0.0G  3.49T   0.0% |   0.00
 65-05    3.49T  64.5G  3.43T    1.8% |   0.0G  3.49T   0.0% |   0.00
 65-06    3.49T  63.5G  3.43T    1.8% |   0.0G  3.49T   0.0% |   0.00
 65-07    3.49T  24.6G  3.47T    0.7% |   0.0G  3.49T   0.0% |   0.00
 65-10    1.75T  62.5G  1.68T    3.5% |   0.0G  1.75T   0.0% |   0.00
 65-11    1.75T  52.2G  1.69T    2.9% |   0.0G  1.75T   0.0% |   0.00
 65-12    1.75T  12.3G  1.73T    0.7% |   0.0G  1.75T   0.0% |   0.00
 65-13    1.75T  53.2G  1.69T    3.0% |   0.0G  1.75T   0.0% |   0.00
 65-14    1.75T  53.2G  1.69T    3.0% |   0.0G  1.75T   0.0% |   0.00
 65-15    1.75T  12.3G  1.73T    0.7% |   0.0G  1.75T   0.0% |   0.00
 65-16    1.75T  53.2G  1.69T    3.0% |   0.0G  1.75T   0.0% |   0.00
 65-17    1.75T  12.3G  1.73T    0.7% |   0.0G  1.75T   0.0% |   0.00
 65-18    1.75T  53.2G  1.69T    3.0% |   0.0G  1.75T   0.0% |   0.00
 65-19    1.75T  53.2G  1.69T    3.0% |   0.0G  1.75T   0.0% |   0.00
 65-20    1.75T 159.7G  1.59T    8.9% |   0.0G  1.75T   0.0% |   0.00
 65-21    1.75T  53.2G  1.69T    3.0% |   0.0G  1.75T   0.0% |   0.00
 65-22    1.75T  53.2G  1.69T    3.0% |   0.0G  1.75T   0.0% |   0.00
 65-23    1.75T  53.2G  1.69T    3.0% |   0.0G  1.75T   0.0% |   0.00
 65-24    1.75T  52.2G  1.69T    2.9% |   0.0G  1.75T   0.0% |   0.00
 65-25    1.75T  52.2G  1.69T    2.9% |   0.0G  1.75T   0.0% |   0.00
 65-26    1.75T  52.2G  1.69T    2.9% |   0.0G  1.75T   0.0% |   0.00
 65-27    1.75T  53.2G  1.69T    3.0% |   0.0G  1.75T   0.0% |   0.00
 65-28    1.75T  12.3G  1.73T    0.7% |   0.0G  1.75T   0.0% |   0.00
 65-29    1.75T  52.2G  1.69T    2.9% |   0.0G  1.75T   0.0% |   0.00
 65-30    1.75T  54.3G  1.69T    3.0% |   0.0G  1.75T   0.0% |   0.00
 75-01    5.24T  78.8G  5.16T    1.5% |   0.0G  5.24T   0.0% |   0.00
 75-03    6.98T  90.1G  6.89T    1.3% |   0.0G  6.98T   0.0% |   0.00
 75-04    6.98T  90.1G  6.89T    1.3% |   0.0G  6.98T   0.0% |   0.00
 75-05    6.98T  50.2G  6.93T    0.7% |   0.0G  6.98T   0.0% |   0.00
 75-06    6.98T  50.2G  6.93T    0.7% |   0.0G  6.98T   0.0% |   0.00
 76-01    1.75T  12.3G  1.73T    0.7% |   0.0G  1.75T   0.0% |   0.00
 76-03    1.75T  53.2G  1.69T    3.0% |   0.0G  1.75T   0.0% |   0.00
 76-04    1.75T  52.2G  1.69T    2.9% |   0.0G  1.75T   0.0% |   0.00
 76-05    1.75T  53.2G  1.69T    3.0% |   0.0G  1.75T   0.0% |   0.00
 76-06    1.75T  96.3G  1.65T    5.4% |   0.0G  1.75T   0.0% |   0.00
 76-07    1.75T  12.3G  1.73T    0.7% |   0.0G  1.75T   0.0% |   0.00
 76-08    1.75T  94.2G  1.65T    5.3% |   0.0G  1.75T   0.0% |   0.00
 76-09    1.75T  93.2G  1.65T    5.2% |   0.0G  1.75T   0.0% |   0.00
 76-10    1.75T  53.2G  1.69T    3.0% |   0.0G  1.75T   0.0% |   0.00
 76-11    1.75T  53.2G  1.69T    3.0% | 199.7G  1.55T  11.2% |   3.75
 76-12    1.75T  12.3G  1.73T    0.7% |   0.0G  1.75T   0.0% |   0.00
 76-13    1.75T  99.3G  1.65T    5.6% |   0.0G  1.75T   0.0% |   0.00
 76-14    1.75T  55.3G  1.69T    3.1% |   0.0G  1.75T   0.0% |   0.00
 79-01    7.28T  51.2G  7.22T    0.7% |   0.0G  7.28T   0.0% |   0.00
 79-02    7.28T  51.2G  7.22T    0.7% |   0.0G  7.28T   0.0% |   0.00
 93-06    1.64T  11.3G  1.62T    0.7% |   0.0G  1.64T   0.0% |   0.00
         ---------------------------------------------------------------
 Total   133.1T  2.59T 130.5T    1.9% | 199.7G 132.9T   0.1% |   0.08
Note: the disk usage and the quota report are compiled 4x/day, the SSD usage is updated every 10m.