| About | CV | Research | Posters | Outreach |

|
|
I am an NSF Astronomy & Astrophysics Postdoctoral Fellow at the Harvard-Smithsonian Center for Astrophysics. I am also a research associate at the American Museum of Natural History in New York.
I study different types of transients - astrophysical phenomena that change on human timescales. I mostly work on supernovae - the explosions of stars - and try to figure out which stars explode as different types of supernovae. To do so, I use images and spectra of the supernovae and their host galaxies, taken with ground and space-based telescopes. My "Supernova Tree of Death," below, shows this in graphical form.  In my PhD thesis, completed in 2013 under the supervision of Profs. Dan Maoz (TAU) and Michael Shara (AMNH), I measured the rates at which Type Ia supernovae exploeded in three surveys, using both imaging and spectroscopy, and showed that these rates were consistent with a progenitor composed of two carbon-oxygen white dwarfs. In 2012, my thesis was animated by Jorge Cham for PhD Comics: Besides research, I am a AAS Astronomy Ambassador and the director of the Science Research Mentoring Program at Harvard. In my free time, I write fiction, and read as much as I can. I am also interested in the history, politics, and culture of ancient Rome, political science, ornithology, and experiencing the world by living somewhere else every once in a while. |
Curriculum Vitae |
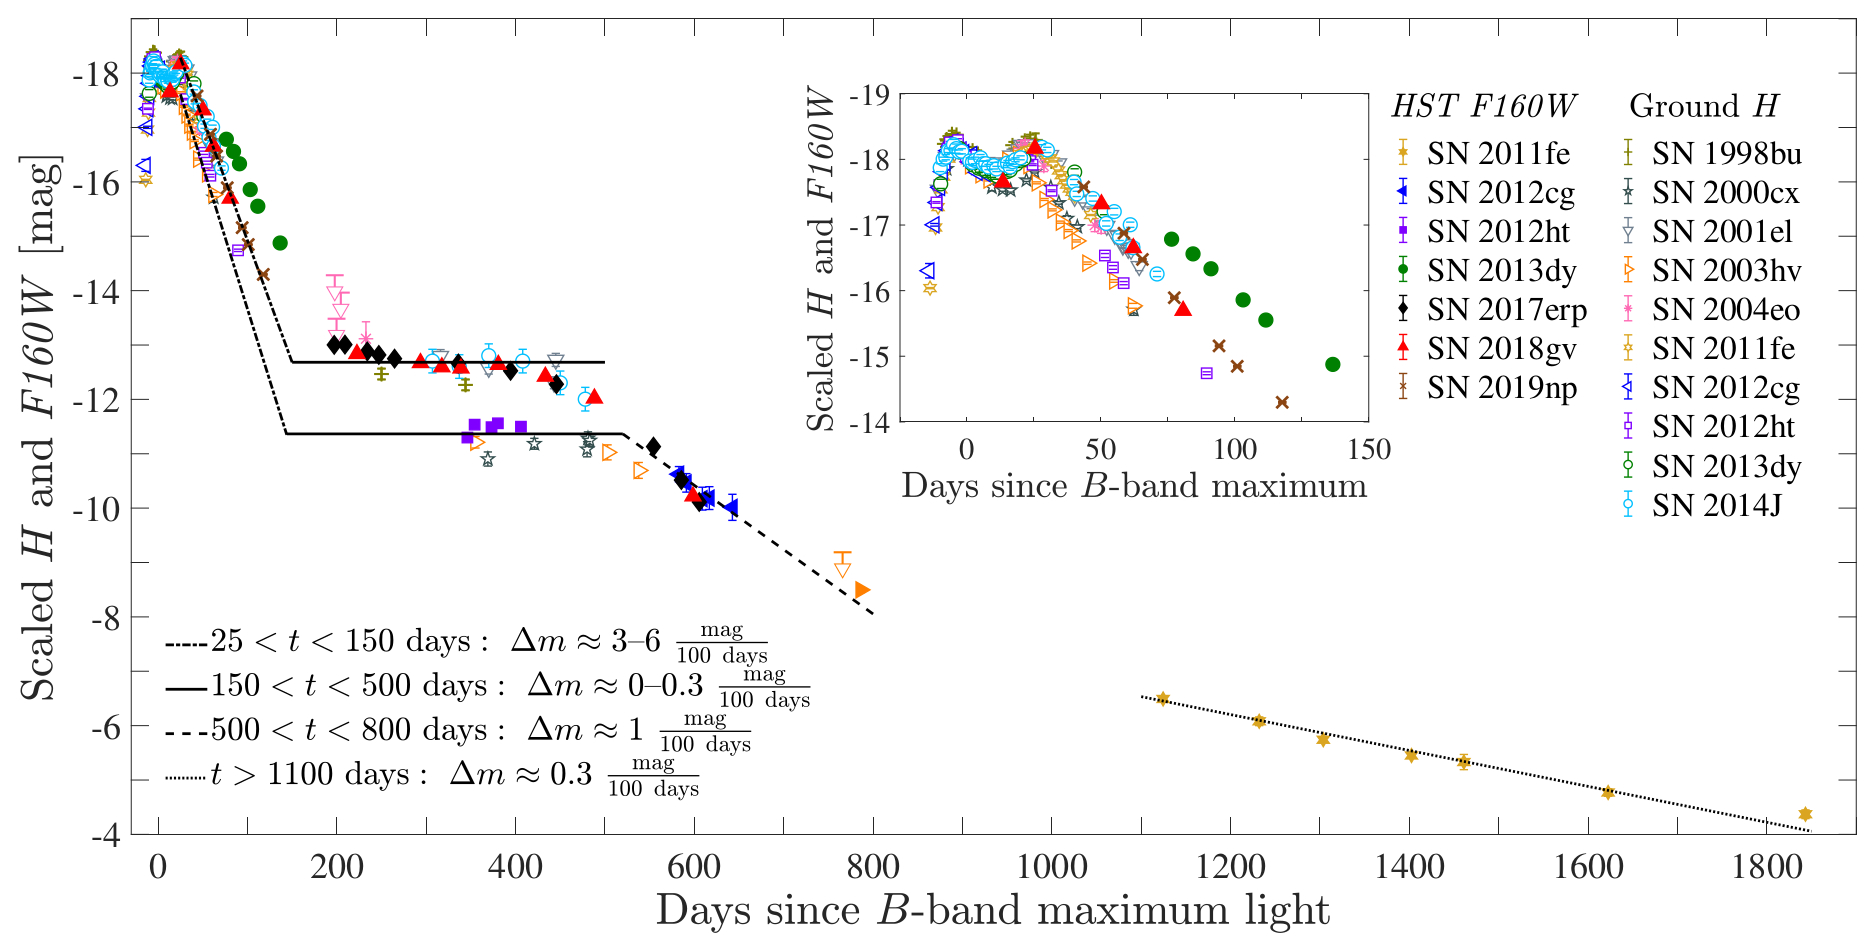
ResearchCurrent highlight In Graur et al. (2019), I show that the near-infrared light curves of Type Ia supernovae plateau between 150 and 500 days after explosion (see figure below). Only Type IIP (where the P stands for "plateau") have been known to display light curve plateaus. There, the plateau is due to a coincindence between the expansion of the supernova ejecta and the recombination timescale of hydrogen. Type Ia supernovae, by definition, are devoid of hydrogen, so there must be a different reason for the plateau. One option is scattering of UV photons from iron lines in the UV into the optical and near-infrared. This scattering might even explain why, instead of crashing, the optical light curves continue to decline and even slow down (Graur et al. 2016, 2018b, 2018c; Graur 2019). Read the full Nature Astronomy article for more. 
Supernova rates and the delay-time distribution The rates at which different types of supernovae explode in various environments can help us constrain the models proposed for their progenitors. Rates as a function of redshift show us how the supernova rate changed over cosmic time. When examining a specific sample of galaxies, correlations between the rates and these galaxies' properties (their stellar mass, star-formation rates, or metallicities) can also connect us to the progenitors of these explosions. I use the rates of Type Ia supernovae to reconstruct their delay-time distribution (DTD), a strong diagnostic of progenitor scenarios. The most up-to-date collection of rates and DTD measurements can be found in Maoz & Graur (2017).
The late-time light curves of Type Ia supernovae, observed with the Hubble Space Telescope The way Type Ia supernovae continue to fade >900 days after explosion (when the supernovae are a million times fainter than at peak!) can be used as a new diagnostic of nebular physics, as well as progenitor and explosion scenarios.
Tidal Disruption Events and their host galaxies When a star strays too close to the super-massive black hole at the center of its galaxy, it can be disrupted by the black hole's gravitational pull. Half of the star's material will be flung away and half will fall into the black hole, giving rise to a luminous flare. The rates of these tidal disruption events (TDEs) can help us understand how they come about, as well as probe the conditions in the direct vicinity of the black hole.
Pre-explosion imaging of Type Ia supernovae with the Hubble Space Telescope
PostersClick on any of the posters for the full-resolution version.
Course Summaries and Data Analysis HandbookFeel free to download the following summaries from my B.Sc. in Physics, but be advised that they are all in Hebrew. The Data Analysis Handbook was written for 1st-year Physics Lab students at Tel-Aviv University, and is also used at the Hebrew University in Jerusalem.Data Analysis for 1st-year Undergraduate Physics Lab Also available from the Tel-Aviv University Neiman Library of Exact Sciences Course summaries: 1st year | 2nd year | 3rd year Education and OutreachAs I describe in Graur (2018a), education and public outreach are an integral part of my career as a scientist. I have been involved in many outreach programs, including the Science Research Mentoring Program (Graur 2018b). The Science Research Mentoring Program
American Museum of Natural History Science Bulletins During 2014-2016, I was the science advisor for the astronomy Science Bulletins produced by the American Museum of Natural History, in which we report on current research in astrophysics.  During my graduate studies at Tel Aviv University, I was one of the organizers of the Tel Aviv University AstroClub, an outreach unit led by graduate students that organized physics and astronomy talks and events for the general public. Webpage designed with the kind help of Keren Sharon. Images courtesy of NASA, ESA, SDSS, Subaru, and the Lick Observatory. Any opinions, findings, and conclusions or recommendations expressed in this material are those of the author and do not necessarily reflect the views of the National Science Foundation. |