| Formation of the Earth | ||||
CalculationsWe use a hybrid planet formation code to compute the formation of terrestrial planets from an initial ensemble of 1-10 km planetesimals. Links below describe the codes.
Figure 1: Model GridWe performed two sets of calculations in 32 annuli at 1 AU.
The figure below shows the small annulus in green. The Sun is the orange dot in the center of the annulus. 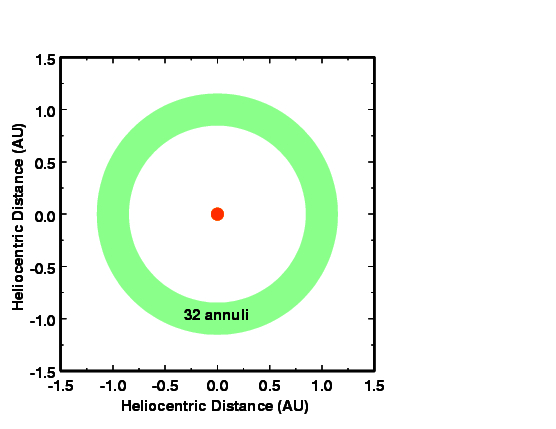
Initial ConditionsWe start with 1-10 km planetesimals in nearly circular orbits around the Sun. The input parameters are the initial surface density and the orbital eccentricity and inclination.
A minimum mass solar nebula (MMSN), with just enough solid material for the terrestrial planets, has X = 1. These calculations include gas drag and velocity evolution from inelastic and elastic collisions, but do not include fragmentation. When objects reach a mass of m = 2 × 1025 g, they are promoted from the coagulation code into the n-body code.
ResultsThe evolution of the planetesimals follows a standard pattern.
In our models, runaway growth leads to the promotion of 10-40 large objects into the n-body code. These objects interact dynamically. Some collide and merge. All continue to accrete from the planetesimal swarm. Eventually, a few of the largest bodies begin to sweep up the lower mass n-bodies as well as the remaining planetesimals. These objects clear out a path along their obits that is relatively free of other objects. For models with initial surface densities of 1-2 minimum mass solar nebulae (X = 1-2), collisions, dynamical interactions, and mergers lead to several objects with masses of 0.25-1.5 Earth masses. The timescale to produce Earth mass planets is roughly 10 Myr. The following figures describe the evolution in more detail.
Figure 2: Evolution of the Number of N-BodiesNumber of n-bodies as a function of time for three calculations. At time t = 0, all objects have radii of 4-15 km; none are in the n-body code. After 10,000 yr, the first large objects begin to form. The number of n-bodies, with masses of 0.2 Lunar masses, peaks at 30,000 to 100,000 yr, when the largest objects have each accumulated roughly 10 lunar masses (0.1 Earth masses). Dynamical interactions then begin to scatter large bodies throughout the grid. Some of these merge to form larger objects. Newly-promoted n-bodies merge quickly with the largest bodies. As mergers continue, the number of n-bodies drops until a few large objects remain.
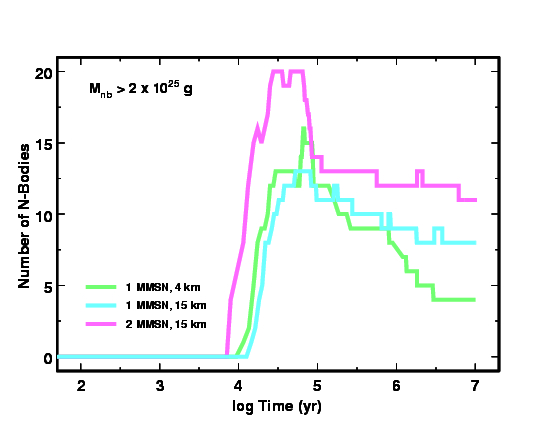
Figure 3: Evolution of the largest objectWe ran many calculations with the same initial conditions. In the figure below, each curve plots the spread in the mass at each time for the ensemble of calculations. The blue and green curves have Σ = 16 g cm-2 at 1 AU; the magenta curves have Σ = 32 g cm-2 at 1 AU. For almost any set of initial conditions, the range in the mass of the largest object is a factor of 2-3. Models starting with smaller objects evolve faster. The arrow indicates the mass of the Earth.
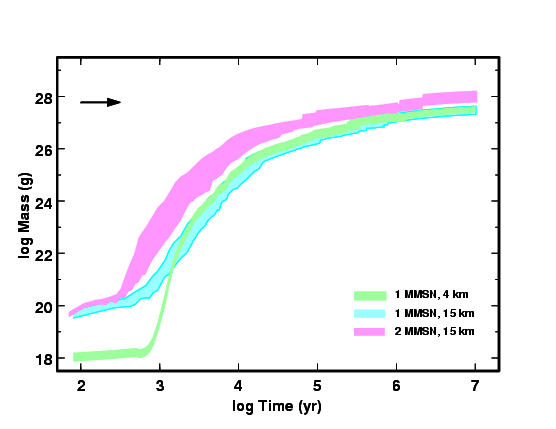
Figure 4: Evolution of eccentricityThe eccentricity of the largest object shows a strong secular evolution to larger eccentricities plus chaotic changes. The figure below shows how the eccentricity evolves for the largest objects in the calculations of Figure 2. For the first 10,000 yr, viscous stirring by large planetesimals raises e while dynamical friction by small planetesimals damps e. After 10,000 yr, interactions between individual bodies raise e; dynamical friction tries to lower e. As objects grow to a significant fraction of an Earth mass, this interplay between chaotic scattering and dynamical friction causes e to oscillate between e = 0.01 and e = 0.1. The arrow indicates e for the Earth.
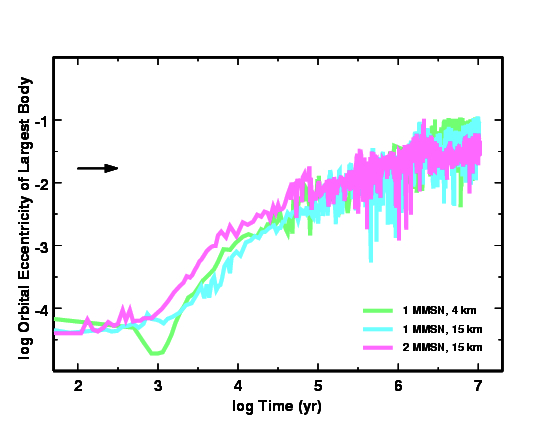
Figure 5: Time evolution of N-Body positions #1The next figure plots the heliocentric distance as a function of time for all of the n-bodies in a calculation with &Sigma: = 15 g cm-2. The dashed lines indicate the inner and outer boundaries of the planetesimal grid. N-bodies can cross these boundaries. At the start of each track, the mass is roughly 0.2 Lunar masses. Bodies accrete mass from the planetesimal swarm and from mergers with other n-bodies. Color changes along a track indicate an n-body + n-body merger. At roughly 100,000 yr, dynamical interactions between n-bodies begin; gravitational scattering produces chaotic orbits and occasional mergers. After 10 Myr, three planets have cleared all but one smaller n-body from the grid. The mass at t = 10 Myr is at the right of each track for the largest surviving n-bodies. The mass of the largest survivor is 50% of the mass of the Earth.
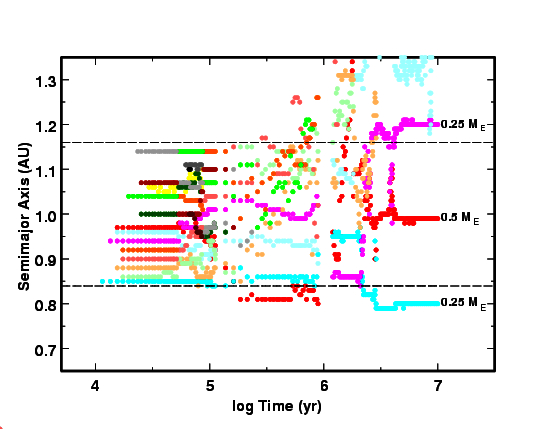
Figure 6: Evolution of N-Body positions #2N-Body positions for a second model with Σ = 15 g cm-2 at 1 AU. Chaotic interactions last longer in this model, but by 10 Myr, two planets with roughly 50% of the mass of the Earth have cleared most of the smaller n-bodies out of the grid.
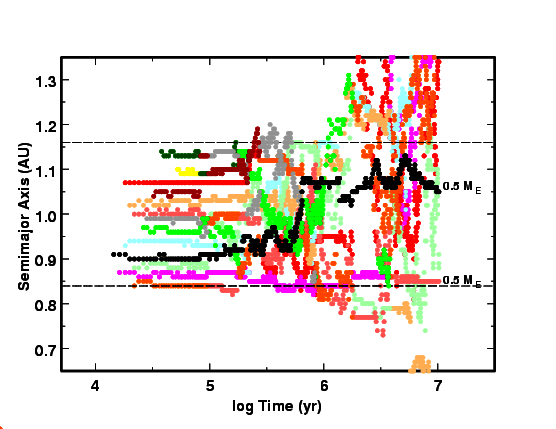
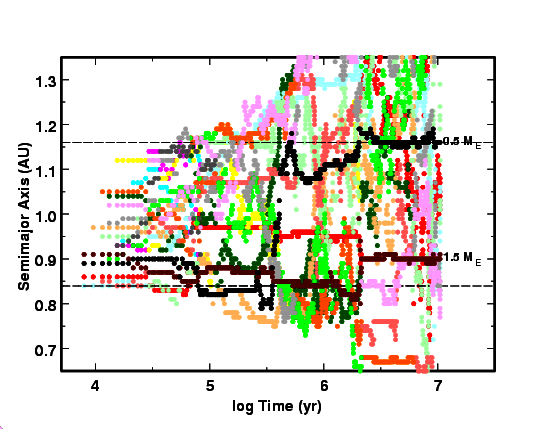
Figure 7: Evolution of N-Body positions #3N-Body positions as a function of time for a model with Σ = 32 g cm-2. Due to the larger initial surface density, planets grow faster. Chaotic interactions and mergers begin sooner. After 2-3 Myr, two large bodies begin to clear out smaller n-bodies in the grid. By 10 Myr, the largest of these is 50% more massive than the Earth.
SAO Home | CfA Home | Dept of Astronomy Home | Smithsonian Institution Home
| ||||