|
|
|
|
|
|
Cyber Meetings FY2022 for CASA tutorial | wSMA
|
|
| |
|
Time -
- Time: March 29, 2022 at 10 am to 11 am EDT
Cyber link -
Agenda -
- Introduction -
Beth:
- 1. Primary goal -
- My goal with my SMA data is to be able to output the final spectrum for my science targets.
- 2. Issues -
- I think we are close to being able to do that in CASA,
so I was hoping you could show me how to do that.
- The other issue is that I was running the script you gave me in early December last night, and it worked for 2 of the sources, but for the other 2 sources, it didn't work correctly. As far as I know, the script you gave me in January did seem to work for all 4 sources.
- Email communication on March 21, 2022
JHZ:
-
2. Demo (continue from 2021-12-15) -
- share screen
- login to RTDC9
- goto /reduction/jzhao/SMA2CASA_TESTING/Users/BethSargent/im_inspec/
- start casa (5.8)
- run IRAS17439imInspec.py (done on 2021-12-15)
- module 0: a summary of tasks
- module 1: convert FITS to CASA
- module 2: inspect image header
- module 3: viewer and inspect image cube
- module 4: viewer and inspect a specific image plane (chan 100)
- module 5: make statistics
Online demo -
- FITS: J154546COcube2.fits
- cp IRAS17439imInspec.py J154546COcube2imInspec.py
- edit line 46, replacing IRAS17439 with J154546COcube2
- run J154546COcube2imInspec.py
- FITS: SCHB_145COcube.fits
- cp IRAS17439imInspec.py SCHB_145COcubeimInspec.py
- edit line 46, replacing IRAS17439 with SCHB_145COcube
- run SCHB_145COcubeimInspec.py
Get the python scripts -
-
Click here for wget instruction
Demo to get a spectrum from an image cube -
- start CASA (5.8)
Assuming the relevant FITS imagecube has been imported to CASA -
CASA <4>: run J154546COcube2imInspec.py
You are in casapy.
Excute current task                   0
Import FITS image                     1
Check the image header                2
View the image cube                   3
View the channel image 100            4
Make statistics on channel image 100  5
Which step do you take?
> 3
move cursor to the top tab of CASA Viewer, click the icon: View,
and then move to the icon Animators and click it
- Pause at the channel 126 or at -735.627 km/s
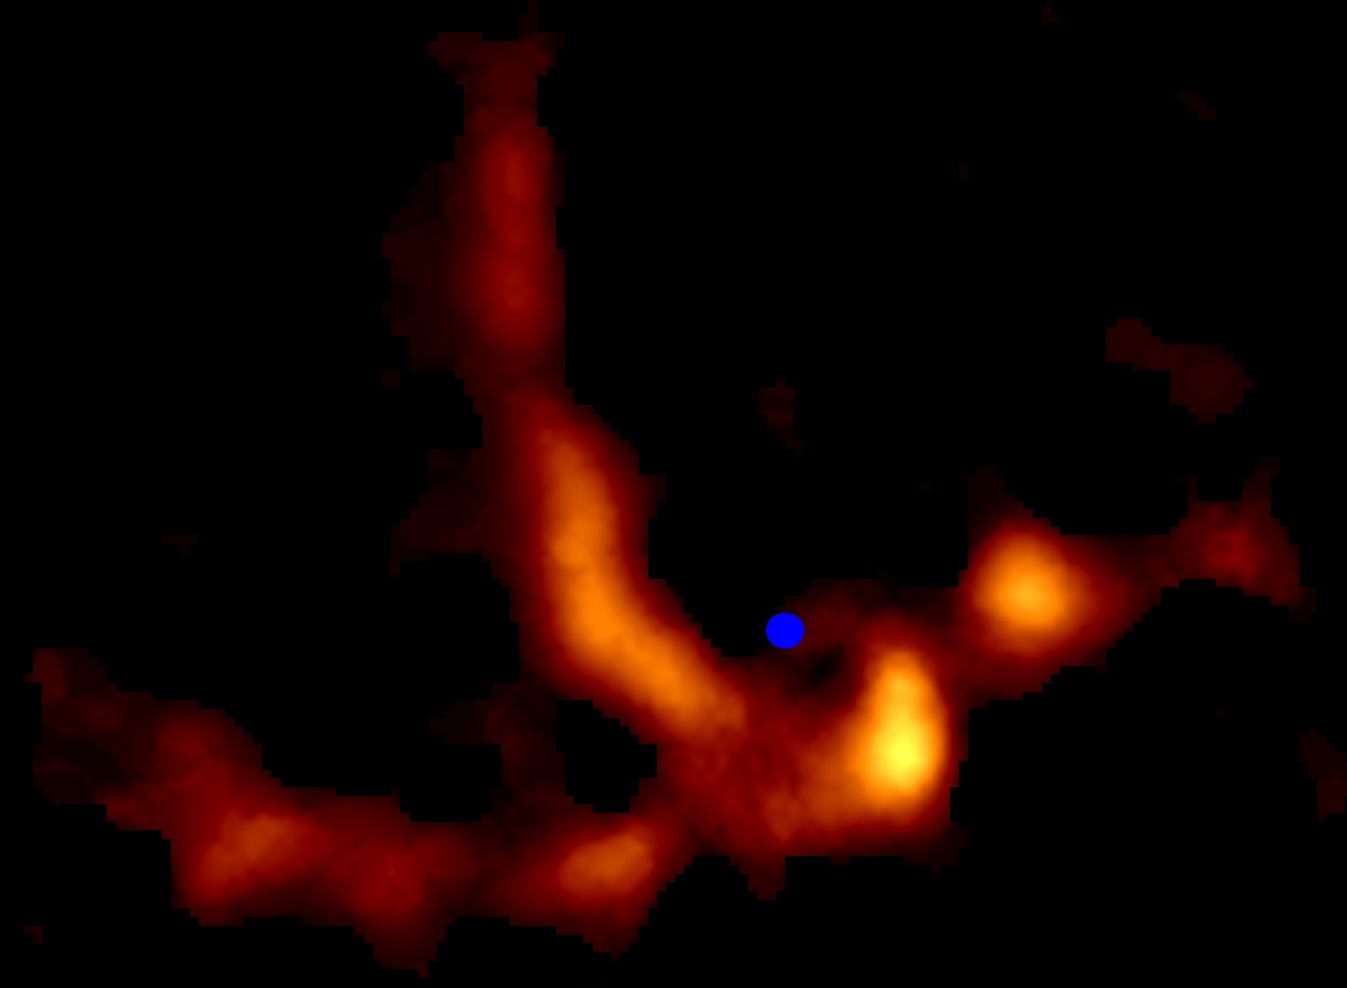
- Choose an emission area (See Fig. 1)
- Click the spectrum icon, and then a spectral plot pops up (see Fig. 2)
 Fig. 1: Channel 126 image of the cube J154546COcube2.tt0.
The ellipse outlines the line emission area at this channel.
Fig. 1: Channel 126 image of the cube J154546COcube2.tt0.
The ellipse outlines the line emission area at this channel.
 Fig. 2: The spectrum extracted from the cube J154546COcube2.tt0
for the elliptical area outlined in Fig. 1. The vertical lightblue line corresponds to
the spectral feature seen in Fig. 1.
Fig. 2: The spectrum extracted from the cube J154546COcube2.tt0
for the elliptical area outlined in Fig. 1. The vertical lightblue line corresponds to
the spectral feature seen in Fig. 1.
| |
| |
| |