Hydra-7@ADC Status
|
Hydra has been moved to the new data center, updates are at the
Data Center Move page. You can view the list of all the available modules: as an HTML document, or a plain ASCII text file. You can also check the bandwidth between SAO and HDC. You can select to have this page refreshed every 5m, 20m, or 1hr, this one will auto-refresh every 1hr. |
-
Usage
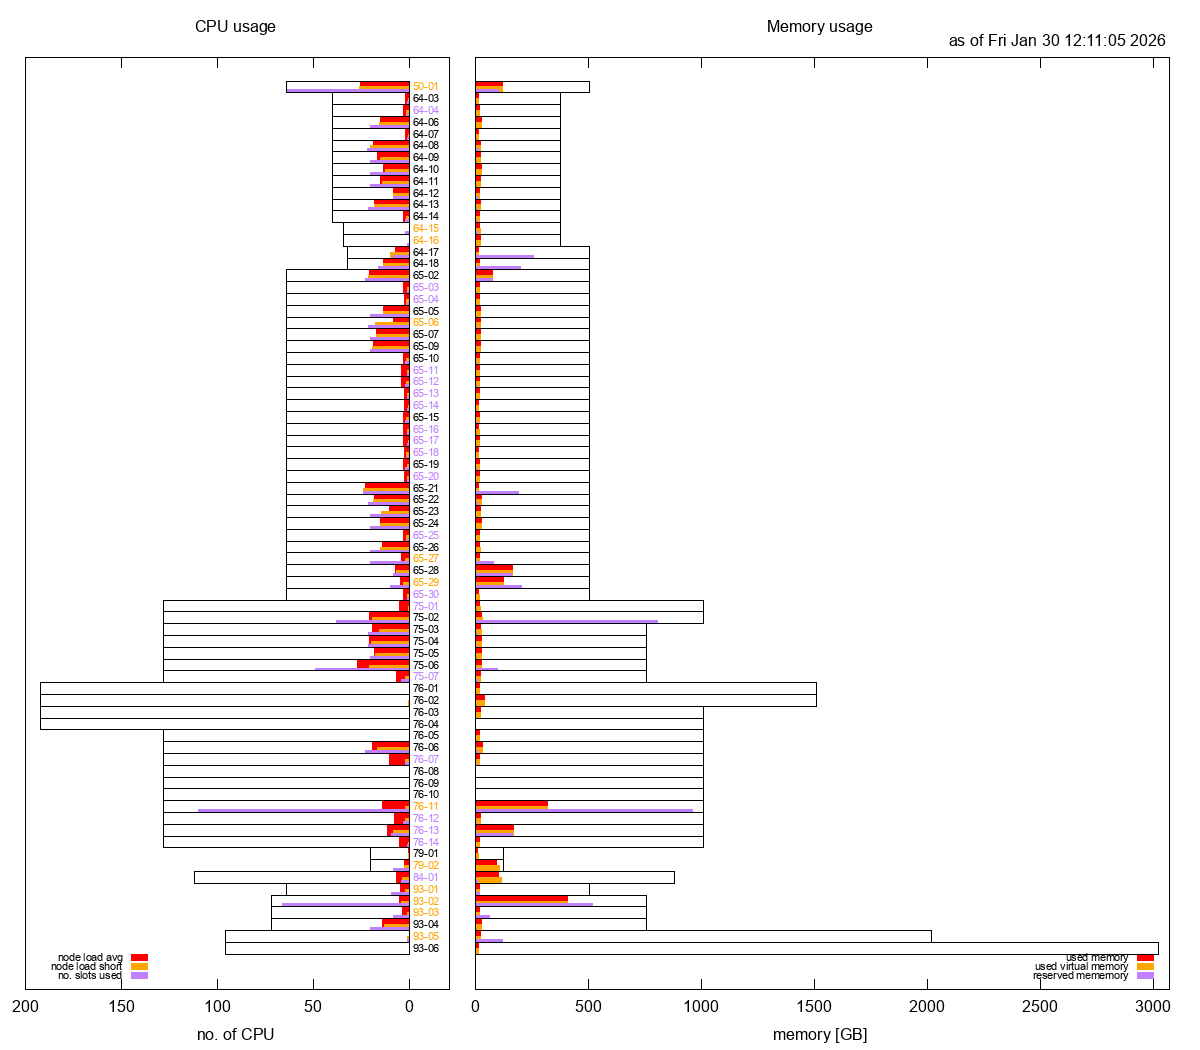
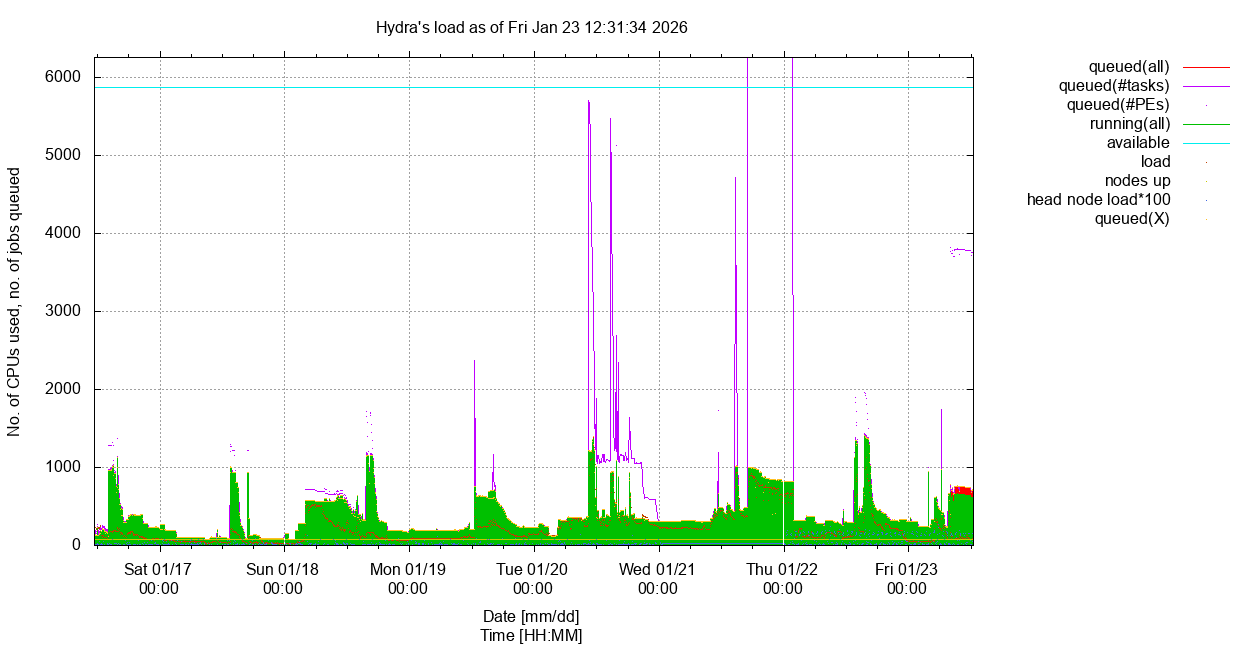
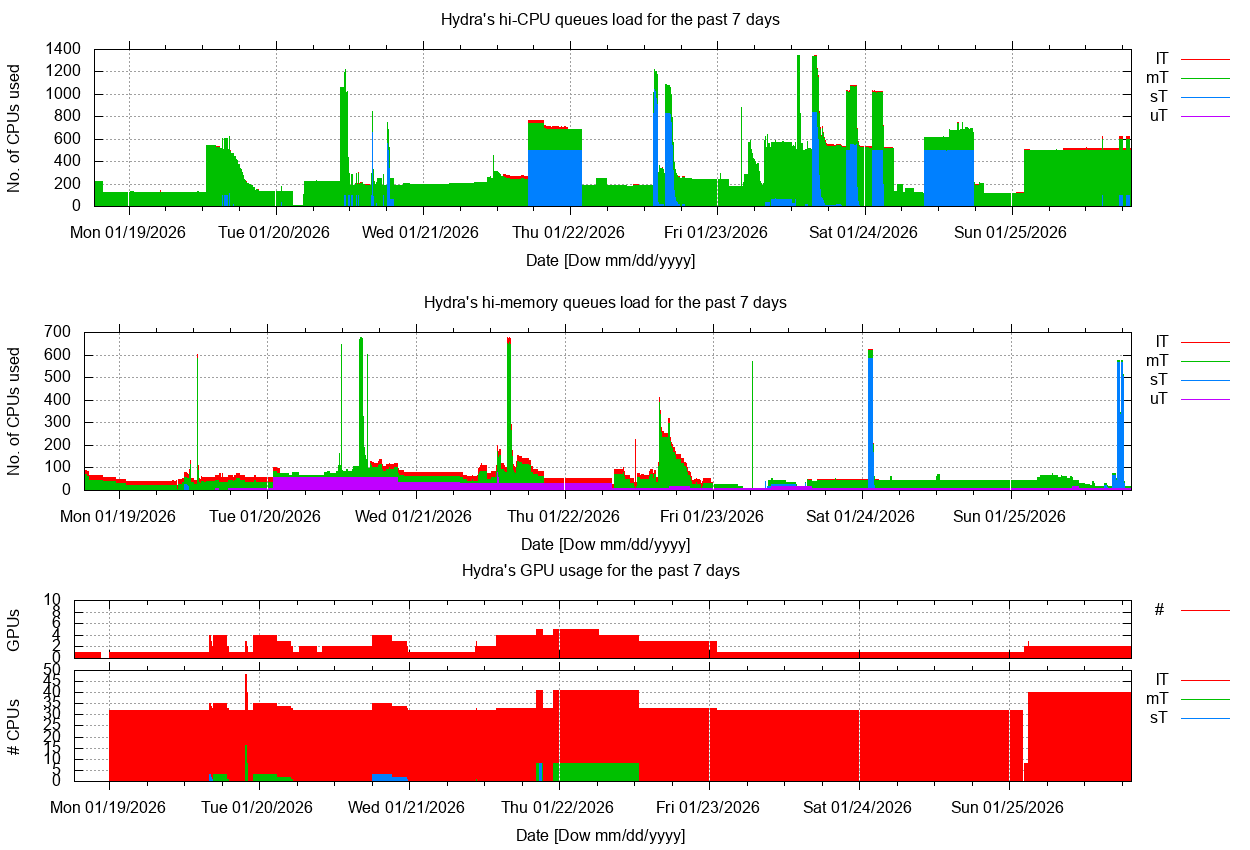
Current snapshot sorted by nodes' . Usage vs time, for length= and user= highlighted.
As of Tue Jul 7 09:27:05 2026: #CPUs/nodes 5396/74, 0 down.
Loads: head node: 2.44, login nodes: 0.18, 0.21, 0.01, 0.04; NSDs: 0.23, 0.23, 0.07, 3.25, 3.05; licenses: none used.
Queues status: 24 disabled, none need attention, none in error state.
24 users with running jobs (slots/jobs):
Current load: 506.9, #running (slots/jobs): 1,039/161, usage: 19.3%, efficiency: 48.8%
6 users with queued jobs (jobs/tasks/slots):
athalappila=1/305/2135 granquistm=1/1/8 johnsone=4/4/75 kimcj=2 taom=1/1/4 whiteae=93/1733/4346 Total number of queued jobs/tasks/slots: 102/2,046/6,570
85 users have/had running or queued jobs over the past 7 days, 104 over the past 15 days. 125 over the past 30 days.
Click on the tabs to view each section, on the plots to view larger versions.
You can view the current cluster snapshot sorted by name, no. cpu, usage, load or memory, and
view the past load for 7, or 15, or 30 days as well as highlight a given user by selecting the corresponding options in the drop down menus.{}
This page was last updated on Tuesday, 07-Jul-2026 09:32:09 EDT with mk-webpage.pl ver. 7.3/1 (Oct 2025/SGK) in 1:03. -
Warnings
Oversubscribed Jobs
As of Tue Jul 7 09:27:05 EDT 2026 (0 oversubscribed job)
Inefficient Jobs
As of Tue Jul  7 09:27:06 EDT 2026 (9 inefficient jobs, showing no more than 3 per user)

Total running (PEs/jobs) = 1039/161, 102 queued (jobs), showing only inefficient jobs (cpu% < 33% & age > 1h) for all users.
     jobID name            user                age nPEs      cpu% queue     node taskID
  14418505 all_SNaQ        flentjeeg        +25:21   16     15.9% uThC.q   65-15
  14963156 train_test_10_M fzaidouni         +1:12    8     11.9% lTgpu.q  50-01
  14965949 assemble_2026-0 kimcj             22:04    1      0.2% lTWFM.sq 64-15
  14966224 run_opt_nrs1_ju szieba            17:31   60     18.1% lThM.q   76-03
  14966225 run_opt_nrs2_ju szieba            17:30   60     15.0% lThM.q   76-14
  14966339 gw_iqtree       mattersonk        14:56   20      5.0% mThC.q   76-08
  14966610 earthaccess_ges ggonzale          05:27    1      1.8% lTIO.sq  64-17
  14966617 A3b_endemism    niez              03:52    4     24.8% mThC.q   93-04
  14966621 allee_cons_YGG0 graujh            02:15   64      1.5% uTxlM.rq 93-05

⇒ Equivalent to 207.7 underused CPUs: 234 CPUs used at 11.3% on average.
Nodes with Excess Load
As of Tue Jul  7 09:27:10 EDT 2026 (3 nodes have a high load, offset=1.5)

                #slots        excess
    node  #CPUs   used   load   load
 -----------------------------------
   50-01     64     20   70.4   50.4 *
   76-04    192     20   31.5   11.5 *
   76-07    128     30   32.1    2.1 *

         Total excess load =  64.0
High Memory Jobs
Statistics
  User                     nSlots       memory        memory         vmem     maxvmem   ratio
  Name                      used        reserved      used           used     used [TB] resd/maxvm
--------------------------------------------------------------------------------------------------
  athalappila            357  49.9%  3.1377  35.8%   0.0005   0.0%   0.0011   0.0011    2907.0
  suttonm                 11   1.5%  2.5625  29.2%   1.2878  84.3%   1.3806   1.3808       1.9
  graujh                 128  17.9%  1.9023  21.7%   0.0592   3.9%   0.0627   0.2092       9.1
  parras                  30   4.2%  0.5859   6.7%   0.1039   6.8%   0.2024   0.2024       2.9
  nevesk                  20   2.8%  0.3906   4.5%   0.0006   0.0%   0.1383   0.1407       2.8
  wirshingh               10   1.4%  0.1172   1.3%   0.0384   2.5%   0.0086   0.0976       1.2
  peresph                 40   5.6%  0.0781   0.9%   0.0288   1.9%   0.0313   0.0320       2.4
  szieba                 120  16.8%  0.0020   0.0%   0.0077   0.5%   0.0371   2.0304       0.0
==================================================================================================
  Total                  716         8.7764          1.5269          1.8622   4.0943       2.1
Warnings
15 high memory jobs produced a warning:
    1 for graujh
    1 for nevesk
    1 for parras
    4 for peresph
    6 for suttonm
    2 for szieba
Details for each job can be found here.
-
Breakdown by Queue
Select length:
Current Usage by Queue
Total Limit Fill factor Efficiency sThC.q=106 mThC.q=136 lThC.q=68 uThC.q=16 326 4856 6.7% 133.1% sThM.q=0 mThM.q=60 lThM.q=564 uThM.q=0 624 4616 13.5% 69.5% sTgpu.q=0 mTgpu.q=12 lTgpu.q=8 qgpu.iq=1 21 104 20.2% 335.9% uTxlM.rq=64 64 536 11.9% 2.4% lThMuVM.tq=0 0 384 0.0% lTb2g.q=0 0 2 0.0% lTIO.sq=1 1 34 2.9% 11.9% lTWFM.sq=1 1 18 5.6% 6.0% qrsh.iq=2 2 292 0.7% 50.6% Total: 1039
-
Avail Slots/Wait Job(s)
Available Slots
As of Tue Jul  7 09:27:07 EDT 2026

3822 avail(slots), free(load)=4803.7, unresd(mem)=28000.8G, for hgrp=@hicpu-hosts and minMem=1.0G/slot
  total(nCPU)      4808 total(mem)   36.3T
  unused(slots)    3822 unused(load) 4803.7  ie:  79.5%  99.9%
  unreserved(mem) 27.3T unused(mem)  33.6T  ie:  75.4%  92.8%
  unreserved(mem)  7.3G unused(mem)   9.0G per unused(slots)

3711 avail(slots), free(load)=4763.7, unresd(mem)=29966.6G, for hgrp=@himem-hosts and minMem=1.0G/slot
  total(nCPU)      4768 total(mem)   39.7T
  unused(slots)    3711 unused(load) 4763.7  ie:  77.8%  99.9%
  unreserved(mem) 29.3T unused(mem)  37.0T  ie:  73.7%  93.2%
  unreserved(mem)  8.1G unused(mem)  10.2G per unused(slots)

472 avail(slots), free(load)=536.0, unresd(mem)=6563.0G, for hgrp=@xlmem-hosts and minMem=1.0G/slot
  total(nCPU)       536 total(mem)    7.9T
  unused(slots)     472 unused(load) 536.0  ie:  88.1% 100.0%
  unreserved(mem)  6.4T unused(mem)   7.8T  ie:  81.4%  98.5%
  unreserved(mem) 13.9G unused(mem)  16.8G per unused(slots)

83 avail(slots), free(load)=102.9, unresd(mem)=390.2G, for hgrp=@gpu-hosts and minMem=1.0G/slot
  total(nCPU)       104 total(mem)    0.7T
  unused(slots)      83 unused(load) 102.9  ie:  79.8%  98.9%
  unreserved(mem)  0.4T unused(mem)   0.7T  ie:  51.7%  91.5%
  unreserved(mem)  4.7G unused(mem)   8.3G per unused(slots)
GPU Usage
Tue Jul  7 09:27:19 EDT 2026
hostgroup: @gpu-hosts (3 hosts)
                - --- memory (GB) ----  -  #GPU - --------- slots/CPUs ---------
hostname        -   total   used   resd -  a/u  - nCPU used   load - free unused
compute-50-01   -   503.3   38.1  465.2 -  4/4  -   64   20   70.4 -   44   -6.4
compute-79-01   -   125.5   12.2  113.3 -  2/0  -   20    0    0.0 -   20   20.0
compute-79-02   -   125.5   13.9  111.6 -  2/1  -   20    1    0.1 -   19   19.9

Total GPU=8, used=5 (62.5%)
Waiting Job(s)
As of Tue Jul  7 09:27:10 EDT 2026

1 job waiting for athalappila:

 jobID     jobName         user              age   nPEs  memReqd queue  taskID
 --------- --------------- ---------------- ------ ---- -------- ------ -------
  14966631 raxml_array.job athalappila       00:13    7     63.0 lThM.q   717-1013:1

 quota rule           resource=value/limit             %used
 -------------------  -------------------------------  ------
 max_hM_slots_per_user/3   slots=364/390                     93.3% for athalappila in queue lThM.q
 max_slots_per_user/1      slots=364/840                     43.3% for athalappila
 max_mem_res_per_user/2    mem_res=3.199T/8.944T             35.8% for athalappila in queue uThM.q
 -------------------  -------------------------------  ------

1 job waiting for granquistm:

 jobID     jobName         user              age   nPEs  memReqd queue  taskID
 --------- --------------- ---------------- ------ ---- -------- ------ -------
  14966640 nf-WF1_ASSEMBLE granquistm        00:00    8     50.0

 quota rule           resource=value/limit             %used
 -------------------  -------------------------------  ------
 max_slots_per_user/1      slots=48/840                       5.7% for granquistm
 max_hC_slots_per_user/1   slots=48/840                       5.7% for granquistm in queue sThC.q
 max_mem_res_per_user/1    mem_res=300.0G/9.985T              2.9% for granquistm in queue uThC.q
 -------------------  -------------------------------  ------

4 jobs waiting for johnsone:

 jobID     jobName         user              age   nPEs  memReqd queue  taskID
 --------- --------------- ---------------- ------ ---- -------- ------ -------
  14966613 cts_recovery_si johnsone          04:25    8     64.0 mThC.q
  14966614 cts_recovery_fi johnsone          04:25   64    128.0 mThC.q
  14966615 cts_recovery_pl johnsone          04:25    2     16.0 mThC.q
  14966616 cts_diag        johnsone          04:25    1      8.0 sThC.q

 quota rule           resource=value/limit             %used
 -------------------  -------------------------------  ------
 max_hC_slots_per_user/2   slots=64/640                      10.0% for johnsone in queue mThC.q
 max_slots_per_user/1      slots=64/840                       7.6% for johnsone
 max_mem_res_per_user/1    mem_res=128.0G/9.985T              1.3% for johnsone in queue uThC.q
 -------------------  -------------------------------  ------

2 jobs waiting for kimcj:

 jobID     jobName         user              age   nPEs  memReqd queue  taskID
 --------- --------------- ---------------- ------ ---- -------- ------ -------
  14966140 assemble_2026-0 kimcj             20:31    1     24.0 lTWFM.sq
  14966180 annotate_2026-0 kimcj             19:31    1     24.0 lTWFM.sq

 quota rule           resource=value/limit             %used
 -------------------  -------------------------------  ------
 max_concurrent_jobs_per_u no_concurrent_jobs=1/1           100.0% for kimcj in queue lTWFM.sq
 wfm_slots_per_user/1      slots=1/2                         50.0% for kimcj in queue lTWFM.sq
 max_slots_per_user/1      slots=1/840                        0.1% for kimcj
 -------------------  -------------------------------  ------

1 job waiting for taom:

 jobID     jobName         user              age   nPEs  memReqd queue  taskID
 --------- --------------- ---------------- ------ ---- -------- ------ -------
  14966444 tr_conus_v6     taom              12:54    4          mTgpu.q

 none running.

93 jobs waiting for whiteae (top 5):

 jobID     jobName         user              age   nPEs  memReqd queue  taskID
 --------- --------------- ---------------- ------ ---- -------- ------ -------
  14966270 v4r_mm16v09     whiteae           15:51    2     60.0
  14966271 v4r_mm16v10     whiteae           15:51    2     60.0
  14966272 v4r_mm17Q2      whiteae           15:51    2     60.0
  14966273 v4r_mm20q05     whiteae           15:51    2     60.0
  14966274 v4r_mm_2015_01  whiteae           15:51    2     60.0

 quota rule           resource=value/limit             %used
 -------------------  -------------------------------  ------
 max_gpus_per_user/2       GPUS=3/6                          50.0% for whiteae in queue mTgpu.q
 total_gpus_per_user/1     GPUS=3/8                          37.5% for whiteae in queue qgpu.iq
 max_slots_per_user/1      slots=12/840                       1.4% for whiteae
 -------------------  -------------------------------  ------
Overall Quota Usage
 quota rule           resource=value/limit             %used
 -------------------  -------------------------------  ------
 total_gpus/1              GPUS=3/8                          37.5% for * in queue mTgpu.q
 total_mem_res/2           mem_res=7.313T/35.78T             20.4% for * in queue uThM.q
 total_mem_res/3           mem_res=1.465T/7.874T             18.6% for * in queue uTxlM.rq
 total_slots/1             slots=1075/5960                   18.0% for *
 blast2GO/1                slots=18/110                      16.4% for *
 total_gpus/1              GPUS=1/8                          12.5% for * in queue qgpu.iq
 total_gpus/1              GPUS=1/8                          12.5% for * in queue lTgpu.q
 total_mem_res/1           mem_res=1.613T/39.94T              4.0% for * in queue uThC.q
-
Memory Usage
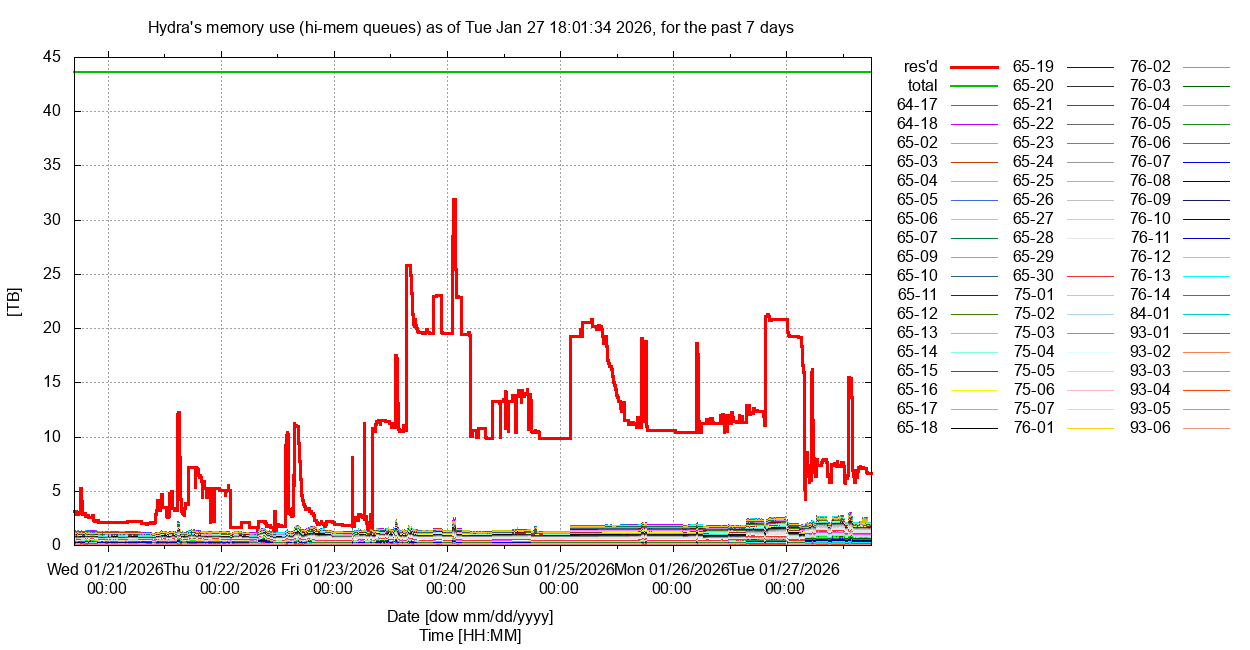
Reserved Memory, All High-Memory Queues
Select length:
Current Memory Quota Usage
As of Tue Jul  7 09:27:11 EDT 2026

quota rule                resource=value/limit              %used filter
---------------------------------------------------------------------------------------------------
total_mem_res/1           mem_res=1.613T/39.94T              4.0% for * in queue uThC.q
total_mem_res/2           mem_res=7.313T/35.78T             20.4% for * in queue uThM.q
total_mem_res/3           mem_res=1.465T/7.874T             18.6% for * in queue uTxlM.rq
Current Memory Usage by Compute Node, High Memory Nodes Only
hostgroup: @himem-hosts (54 hosts)
                - ----------- memory (GB) ------------  - --------- slots/CPUs ---------
hostname        -   avail   used   resd - unused unresd - nCPU used   load - free unused
compute-65-02   -   503.5   15.7  103.0 -  487.8  400.5 -   64   12    5.3 -   52   58.7
compute-65-03   -   503.5   14.8   95.0 -  488.7  408.5 -   64   11    4.9 -   53   59.1
compute-65-04   -   503.5   12.7  126.0 -  490.8  377.5 -   64   14    1.8 -   50   62.2
compute-65-05   -   503.5   13.4  126.0 -  490.1  377.5 -   64   14    1.7 -   50   62.3
compute-65-06   -   503.5   13.8   66.0 -  489.7  437.5 -   64   10    2.9 -   54   61.1
compute-65-07   -   503.5   13.0  134.0 -  490.5  369.5 -   64   15    2.2 -   49   61.8
compute-65-09   -   503.5   13.0  134.0 -  490.5  369.5 -   64   15    2.2 -   49   61.8
compute-65-10   -   503.5   13.1  134.0 -  490.4  369.5 -   64   15    2.1 -   49   61.9
compute-65-11   -   503.5   12.9  126.0 -  490.6  377.5 -   64   14    1.8 -   50   62.2
compute-65-12   -   503.5   42.3  128.0 -  461.2  375.5 -   64   16    9.0 -   48   55.0
compute-65-13   -   503.5   14.4  126.0 -  489.1  377.5 -   64   14    1.9 -   50   62.0
compute-65-14   -   503.5   14.0   66.0 -  489.5  437.5 -   64   10    2.9 -   54   61.1
compute-65-15   -   503.5   34.5  128.0 -  469.0  375.5 -   64   16   10.0 -   48   54.0
compute-65-16   -   503.5   14.2   58.0 -  489.3  445.5 -   64    9    2.1 -   55   61.9
compute-65-17   -   503.5   13.0  134.0 -  490.5  369.5 -   64   15    2.2 -   49   61.8
compute-65-18   -   503.5   16.3  136.0 -  487.2  367.5 -   64   12   11.3 -   52   52.7
compute-65-19   -   503.5   12.8  126.0 -  490.7  377.5 -   64   14    1.7 -   50   62.3
compute-65-20   -   503.5   14.4  134.0 -  489.1  369.5 -   64   15    2.1 -   49   61.9
compute-65-21   -   503.5   13.0   58.0 -  490.5  445.5 -   64    9    2.3 -   55   61.7
compute-65-22   -   503.5   16.4    2.0 -  487.1  501.5 -   64    8    7.7 -   56   56.3
compute-65-23   -   503.5   14.6   87.0 -  488.9  416.5 -   64   10    3.8 -   54   60.2
compute-65-24   -   503.5   13.8   79.0 -  489.7  424.5 -   64    9    2.9 -   55   61.1
compute-65-25   -   503.5   14.7  126.0 -  488.8  377.5 -   64   14    1.7 -   50   62.3
compute-65-26   -   503.5  105.9  327.0 -  397.6  176.5 -   64    9    3.1 -   55   60.9
compute-65-27   -   503.5   15.7   87.0 -  487.8  416.5 -   64   10    3.9 -   54   60.1
compute-65-28   -   503.5   14.0  126.0 -  489.5  377.5 -   64   14    1.7 -   50   62.3
compute-65-29   -   503.5   15.0   95.0 -  488.5  408.5 -   64   11    4.9 -   53   59.1
compute-65-30   -   503.5   13.4  134.0 -  490.1  369.5 -   64   15    2.2 -   49   61.8
compute-75-01   -  1007.5   18.8  166.1 -  988.7  841.4 -  128   19    6.7 -  109  121.3
compute-75-02   -  1007.5   23.9   83.0 -  983.6  924.5 -  128   17   10.9 -  111  117.1
compute-75-03   -   755.5  104.2  400.0 -  651.3  355.5 -  128   67   60.0 -   61   68.0
compute-75-04   -   755.5  234.4  513.0 -  521.1  242.5 -  128   17   10.8 -  111  117.2
compute-75-05   -   755.5   16.4  150.0 -  739.1  605.5 -  128   17    4.8 -  111  123.2
compute-75-06   -   755.5   16.7  128.0 -  738.8  627.5 -  128   22    6.0 -  106  122.0
compute-75-07   -   755.5   16.4  150.0 -  739.1  605.5 -  128   17    6.0 -  111  122.0
compute-76-03   -  1007.4   35.2   22.5 -  972.2  984.9 -  128   70   24.6 -   58  103.4
compute-76-04   -  1007.4   65.8  400.0 -  941.6  607.4 -  128   20   21.0 -  108  107.0
compute-76-05   -  1007.4   25.5   83.0 -  981.9  924.4 -  128   17   10.6 -  111  117.4
compute-76-06   -  1007.4   16.1  121.0 -  991.3  886.4 -  128   16    3.6 -  112  124.4
compute-76-07   -  1007.4  169.1  600.0 -  838.3  407.4 -  128   30   32.1 -   98   95.9
compute-76-08   -  1007.4  278.9  518.0 -  728.5  489.4 -  128   37    5.7 -   91  122.3
compute-76-09   -  1007.4   23.9   52.0 -  983.5  955.4 -  128   16    8.9 -  112  119.1
compute-76-10   -  1007.4  302.8  448.0 -  704.6  559.4 -  128   65   46.5 -   63   81.5
compute-76-11   -  1007.4   35.1  448.0 -  972.3  559.4 -  128   64   20.3 -   64  107.7
compute-76-12   -  1007.4   22.6   83.0 -  984.8  924.4 -  128   17   10.5 -  111  117.5
compute-76-13   -  1007.4  178.1  358.0 -  829.3  649.4 -  128   20    6.6 -  108  121.4
compute-76-14   -  1007.4  377.6  514.0 -  629.8  493.4 -  128   62   12.3 -   66  115.7
compute-84-01   -   881.1   18.1  158.0 -  863.0  723.1 -  112   18    5.9 -   94  106.1
compute-93-01   -   503.8   60.1  335.0 -  443.7  168.8 -   64   10    3.9 -   54   60.1
compute-93-02   -   755.6   15.5   95.0 -  740.1  660.6 -   72   11    5.1 -   61   66.9
compute-93-03   -   755.6   77.3  314.0 -  678.3  441.6 -   72   10    3.0 -   62   69.0
compute-93-04   -   755.6   18.5  103.0 -  737.1  652.6 -   72   13    4.3 -   59   67.7
compute-93-05   -  2016.3   55.8 1500.0 - 1960.5  516.3 -   96   64    1.0 -   32   95.0
compute-93-06   -  3023.9   13.0    0.0 - 3010.9 3023.9 -   56    0    0.0 -   56   56.0
                   ======= ===== ======                   ==== ====  =====
Totals             40671.2 2754.6 10943.6                   4768 1086  433.3
                       ==>   6.8%  26.9%                  ==>  22.8%   9.1%
Most unreserved/unused memory (3023.9/3010.9GB) is on compute-93-06 with 56/56.0 slots/CPUs free/unused.

hostgroup: @xlmem-hosts (4 hosts)
                - ----------- memory (GB) ------------  - --------- slots/CPUs ---------
hostname        -   avail   used   resd - unused unresd - nCPU used   load - free unused
compute-76-01   -  1511.4   13.7   -0.0 - 1497.7 1511.4 -  192    0    0.0 -  192  192.0
compute-76-02   -  1511.4   40.8   -0.0 - 1470.6 1511.4 -  192    0    0.5 -  192  191.5
compute-93-05   -  2016.3   55.8 1500.0 - 1960.5  516.3 -   96   64    1.0 -   32   95.0
compute-93-06   -  3023.9   13.0    0.0 - 3010.9 3023.9 -   56    0    0.0 -   56   56.0
                   ======= ===== ======                   ==== ====  =====
Totals             8063.0  123.3 1500.0                    536   64    1.5
                       ==>   1.5%  18.6%                  ==>  11.9%   0.3%
Most unreserved/unused memory (3023.9/3010.9GB) is on compute-93-06 with 56/56.0 slots/CPUs free/unused.
Past Memory Usage vs Memory Reservation
Past memory use in hi-mem queues between 06/24/26 and 07/01/26
queues: ?ThM.q
                ----------- total ---------  -------------------- mean --------------------
user                 no. of    elapsed time   eff. reserved  maxvmem  average  ratio
name                jobs/slots     [d]        [%]     [GB]     [GB]     [GB]   resd/maxvmem
--------------- -------------- ------------ ----- --------- -------- --------- ------------
santossam              2/2          0.00     60.0     36.0      0.0      0.0      0.0
graujh                 3/192        0.00      0.5    448.0      0.0      0.0      0.0
macdonaldk             3/36         0.00     75.8    288.0      1.8      0.6    155.8 > 2.5
longk                  8/132        0.00    131.6    130.8     25.4     11.6      5.2 > 2.5
lealc                  1/18         0.00     40.0    216.0     77.5      0.8      2.8 > 2.5
johnsone              25/25         0.00     91.8     64.0     19.5     12.1      3.3 > 2.5
sossajef               1/1          0.02     91.6     12.0      1.0      0.3     12.4 > 2.5
bourkeb                3/32         0.04     13.6    256.0      2.1      0.5    121.0 > 2.5
sandoval-velascom      3/3          0.04    100.3     72.0      1.0      0.3     72.4 > 2.5
fenilic                3/12         0.07     26.3    600.0     41.4     36.4     14.5 > 2.5
hoffmannmeyerg        49/49         0.07     97.3     32.0      0.1      0.0    532.5 > 2.5
ariasc                 7/190        0.08     34.3    596.4     98.6     33.3      6.1 > 2.5
santosbe              11/416        0.17     89.9    218.4     74.8      1.3      2.9 > 2.5
farmers                6/41         0.28     97.7    235.2    180.3     46.3      1.3
morrisseyd             5/64         0.31     59.9    633.1    150.7      4.7      4.2 > 2.5
przelomskan           12/12         0.34    288.8     25.6      4.9      1.2      5.2 > 2.5
flentjeeg              4/16         0.38    105.3    800.0    412.6     63.9      1.9
granquistm             4/24         0.45     87.5     50.0     15.3      5.9      3.3 > 2.5
kweskinm             228/612        0.45     35.3      8.0     11.5      8.0      0.7
atkinsonga             7/124        0.47    128.8    220.0     56.6     30.9      3.9 > 2.5
parras                14/56         0.68     26.2    600.0     40.5     40.0     14.8 > 2.5
macguigand           134/350        0.71     19.6     86.5     12.4      0.7      7.0 > 2.5
jmichail               8/80         0.75     32.6    127.6     43.0      4.2      3.0 > 2.5
coellogarridoa       179/1043       0.79    311.6   1005.6    286.3      3.9      3.5 > 2.5
girardmg             349/544        1.42      8.8     33.8      4.5      0.2      7.5 > 2.5
palmerem            1363/1363       2.46    100.0    299.1      6.7      2.3     45.0 > 2.5
campanam            3830/11322      3.98    124.7     19.9     12.8     12.1      1.6
sylvain               11/11         4.43     99.7    113.7      2.9      2.8     39.6 > 2.5
szieba               154/5272       5.67     15.7      6.7   1537.8      5.4      0.0
horowitzj           5760/5760       5.91     84.2     16.0      2.3      1.3      7.0 > 2.5
collinsa             316/4268       7.69     87.4    145.2      9.3      4.2     15.6 > 2.5
willishr             273/2176       8.83     58.8     42.8     20.0     11.9      2.1
johnsonsj             58/58         9.38     99.6     32.0     29.2      6.2      1.1
nevesk              1112/13344     10.78     76.4    600.0     18.2      7.4     33.0 > 2.5
kressleinr           309/1236      11.37     90.7    100.0     25.3      7.2      4.0 > 2.5
kimcj               1463/3077      14.66     29.4     64.0     17.2      2.6      3.7 > 2.5
zhangy                22/320       17.57     70.5    206.4    325.5      2.9      0.6
quattrinia         21261/21283     20.96     89.6     16.1      1.2      0.6     13.0 > 2.5
cnowlan             1544/1544      21.19     99.4     10.0      7.1      5.8      1.4
niez                  94/1504      25.96     42.0    160.0     86.2     47.8      1.9
--------------- -------------- ------------ ----- --------- -------- --------- ------------
all                38639/76612    178.40     73.7    125.4    105.5     11.4      1.2
---
queues: ?TxlM.rq
                ----------- total ---------  -------------------- mean --------------------
user                 no. of    elapsed time   eff. reserved  maxvmem  average  ratio
name                jobs/slots     [d]        [%]     [GB]     [GB]     [GB]   resd/maxvmem
--------------- -------------- ------------ ----- --------- -------- --------- ------------
graujh                 4/224        2.21      1.2   1089.5    761.7    420.2      1.4
--------------- -------------- ------------ ----- --------- -------- --------- ------------
all                    4/224        2.21      1.2   1089.5    761.7    420.2      1.4
-
Resource Limits
    Limit slots for all users together
    users * to slots=5960
    users * queues sThC.q,lThC.q,mThC.q,uThC.q to slots=5176
    users * queues sThM.q,mThM.q,lThM.q,uThM.q to slots=4680
    users * queues uTxlM.rq to slots=536
    users * queues sTgpu.q,mTgpu.q,lTgpu.q to slots=104

    Limit total reserved memory for all users per queue type
    users * queues sThC.q,mThC.q,lThC.q,uThC.q to mem_res=40902G
    users * queues sThM.q,mThM.q,lThM.q,uThM.q to mem_res=36637G
    users * queues uTxlM.rq to mem_res=8063G

    Limit slots/user for all queues
    users {*} to slots=840

    Limit slots/user for hiMem queues
    users {*} queues {sThM.q} to slots=840
    users {*} queues {mThM.q} to slots=585
    users {*} queues {lThM.q} to slots=390
    users {*} queues {uThM.q} to slots=73

    Limit slots/user for xlMem restricted queue
    users {*} queues {uTxlM.rq} to slots=536

    Limit GPUs for all users in GPU queues to the avail no of GPUs
    users * queues {sTgpu.q,mTgpu.q,lTgpu.q,qgpu.iq} to GPUS=8

    Limit to set aside a slot for blast2GO
    users * queues !lTb2g.q hosts {@b2g-hosts} to slots=110
    users * queues lTb2g.q hosts {@b2g-hosts} to slots=1
    users {*} queues lTb2g.q hosts {@b2g-hosts} to slots=1

    Limit GPUs per user in all the GPU queues
    users {@gpu-power-users} queues sTgpu.q,mTgpu.q,lTgpu.q,
   qgpu.iq to GPUS=8
    users {*} queues sTgpu.q,mTgpu.q,lTgpu.q,qgpu.iq to GPUS=4

    Limit GPUs per user in each GPU queues
    users {@gpu-power-users} queues {sTgpu.q} to GPUS=8
    users {@gpu-power-users} queues {mTgpu.q} to GPUS=6
    users {@gpu-power-users} queues {lTgpu.q} to GPUS=4
    users {@gpu-power-users} queues {qgpu.iq} to GPUS=2
    users {*} queues {sTgpu.q} to GPUS=4
    users {*} queues {mTgpu.q} to GPUS=3
    users {*} queues {lTgpu.q} to GPUS=2
    users {*} queues {qgpu.iq} to GPUS=1

    Limit total number of idl licenses per user
    users {*} to idlrt_license=102

    Limit slots for io queue per user
    users {*} queues {lTIO.sq} to slots=8

    Limit slots for io queue per user
    users {*} queues {lTWFM.sq} to slots=2

    Limit slots/user for interactive (qrsh) queues
    users {*} queues {qrsh.iq} to slots=64

    Limit reserved memory per user for specific queues
    users {*} queues sThC.q,mThC.q,lThC.q,uThC.q to mem_res=10225G
    users {*} queues sThM.q,mThM.q,lThM.q,uThM.q to mem_res=9159G
    users {*} queues uTxlM.rq to mem_res=8063G

    Limit slots/user in hiCPU queues
    users {*} queues {sThC.q} to slots=840
    users {*} queues {mThC.q} to slots=640
    users {*} queues {lThC.q} to slots=431
    users {*} queues {uThC.q} to slots=143

    Limit the number of concurrent jobs per user for some queues
    users {*} queues {uTxlM.rq} to no_concurrent_jobs=3
    users {*} queues {lTIO.sq} to no_concurrent_jobs=6
    users {*} queues {lTWFM.sq} to no_concurrent_jobs=1
    users {*} queues {qrsh.iq} to no_concurrent_jobs=12
    users {*} queues {qgpu.iq} to no_concurrent_jobs=1
-
Disk Usage & Quota
As of Tue Jul 7 05:06:02 EDT 2026
Disk Usage
Filesystem                              Size     Used    Avail Capacity  Mounted on

netapp-fas83:/vol_home                  22.36T   20.15T    2.22T  91%/13%  /home
netapp-fas83-n01:/vol_data_public      332.50T  121.06T  211.44T  37%/2%   /data/public
gpfs02:public                          800.00T  593.31T  206.69T  75%/32%  /scratch/public
gpfs02:nmnh_bradys                      25.00T   20.68T    4.32T  83%/59%  /scratch/bradys
gpfs02:nmnh_kistlerl                   120.00T   94.66T   25.34T  79%/14%  /scratch/kistlerl
gpfs02:nmnh_meyerc                      25.00T   21.18T    3.82T  85%/8%   /scratch/meyerc
gpfs02:nmnh_corals                      60.00T   55.52T    4.48T  93%/24%  /scratch/nmnh_corals
gpfs02:nmnh_ggi                        130.00T   36.51T   93.49T  29%/15%  /scratch/nmnh_ggi
gpfs02:nmnh_lab                         25.00T   14.57T   10.43T  59%/13%  /scratch/nmnh_lab
gpfs02:nmnh_mammals                     35.00T   29.87T    5.13T  86%/39%  /scratch/nmnh_mammals
gpfs02:nmnh_mdbc                        60.00T   52.33T    7.67T  88%/26%  /scratch/nmnh_mdbc
gpfs02:nmnh_ocean_dna                   90.00T   65.20T   24.80T  73%/6%   /scratch/nmnh_ocean_dna
gpfs02:nzp_ccg                         145.00T   40.21T  104.79T  28%/51%  /scratch/nzp_ccg
gpfs01:ocio_dpo                         10.00T    2.59T    7.41T  26%/1%   /scratch/ocio_dpo
gpfs01:ocio_ids                          5.00T    0.00G    5.00T   0%/1%   /scratch/ocio_ids
gpfs02:pool_kozakk                      12.00T   10.67T    1.33T  89%/2%   /scratch/pool_kozakk
gpfs02:pool_sao_access                  50.00T    4.79T   45.21T  10%/9%   /scratch/pool_sao_access
gpfs02:pool_sao_rtdc                    20.00T  908.33G   19.11T   5%/1%   /scratch/pool_sao_rtdc
gpfs02:sao_atmos                       350.00T  309.00T   41.00T  89%/12%  /scratch/sao_atmos
gpfs02:sao_cga                          25.00T    9.44T   15.56T  38%/28%  /scratch/sao_cga
gpfs02:sao_tess                         50.00T   23.25T   26.75T  47%/70%  /scratch/sao_tess
gpfs02:scbi_gis                        200.00T  142.10T   57.90T  72%/8%   /scratch/scbi_gis
gpfs02:nmnh_schultzt                    35.00T   25.33T    9.67T  73%/75%  /scratch/schultzt
gpfs02:serc_cdelab                      35.00T    8.87T   26.13T  26%/5%   /scratch/serc_cdelab
gpfs02:stri_ap                          25.00T   21.80T    3.20T  88%/2%   /scratch/stri_ap
gpfs01:sao_sylvain                     145.00T   46.73T   98.27T  33%/23%  /scratch/sylvain
gpfs02:usda_sel                         25.00T   15.47T    9.53T  62%/27%  /scratch/usda_sel
gpfs02:wrbu                             50.00T   45.03T    4.97T  91%/14%  /scratch/wrbu
nas1:/mnt/pool/public                  175.00T  108.90T   66.10T  63%/1%   /store/public
nas1:/mnt/pool/nmnh_bradys              40.00T   14.58T   25.42T  37%/1%   /store/bradys
nas2:/mnt/pool/n1p3/nmnh_ggi            90.00T   36.28T   53.72T  41%/1%   /store/nmnh_ggi
nas2:/mnt/pool/nmnh_lab                 40.00T   16.61T   23.39T  42%/1%   /store/nmnh_lab
nas2:/mnt/pool/nmnh_ocean_dna           70.00T   34.40T   35.60T  50%/1%   /store/nmnh_ocean_dna
nas1:/mnt/pool/nzp_ccg                 265.00T  127.30T  137.70T  49%/1%   /store/nzp_ccg
nas2:/mnt/pool/nzp_cec                  40.00T   20.71T   19.29T  52%/1%   /store/nzp_cec
nas2:/mnt/pool/n1p2/ocio_dpo            20.00T    0.00G   20.00T   1%/1%   /store/ocio_dpo
nas2:/mnt/pool/n1p1/sao_atmos          750.00T  474.52T  275.48T  64%/1%   /store/sao_atmos
nas2:/mnt/pool/n1p2/nmnh_schultzt       80.00T   24.96T   55.04T  32%/1%   /store/schultzt
nas1:/mnt/pool/sao_sylvain              50.00T    9.64T   40.36T  20%/1%   /store/sylvain
nas1:/mnt/pool/wrbu                     80.00T   10.02T   69.98T  13%/1%   /store/wrbu
nas1:/mnt/pool/admin                    20.00T    8.06T   11.94T  41%/1%   /store/admin
You can view plots of disk use vs time, for the past 7, 30, or 120 days; as well as plots of disk usage by user, or by device (for the past 90 or 240 days respectively).Notes
Capacity shows % disk space full and % of inodes used.
When too many small files are written on a disk, the file system can become full because it is unable to keep track of new files.
The % of inodes should be lower or comparable to the % of disk space used.
If it is much larger, the disk can become unusable before it gets full.
Disk Quota Report
Volume=NetApp:vol_data_public, mounted as /data/public
                     --  disk   --     --  #files --     default quota:  4.50TB/10.0M
Disk                 usage   %quota    usage  %quota     name, affiliation - username (indiv. quota)
-------------------- ------- ------    ------ ------     -------------------------------------------
/data/public          4.14TB  92.0%     5.07M  50.7%     Alicia Talavera, NMNH - talaveraa

Volume=NetApp:vol_home, mounted as /home
                     --  disk   --     --  #files --     default quota: 384.0GB/10.0M
Disk                 usage   %quota    usage  %quota     name, affiliation - username (indiv. quota)
-------------------- ------- ------    ------ ------     -------------------------------------------
/home                384.5GB 100.1%     0.10M   1.0% *** Alison Fowler, NZCBI - fowlera
/home                375.5GB  97.8%     0.09M   0.9% *** Rebeka Tamasi Bottger, SAO/OIR - rbottger
/home                363.6GB  94.7%     0.27M   2.7%     Juan Uribe, NMNH - uribeje
/home                348.5GB  90.8%     2.94M  29.4%     Brian Bourke, WRBU - bourkeb
/home                329.1GB  85.7%     0.00M   0.0%     Allan Cabrero, NMNH - cabreroa
/home                328.4GB  85.5%     1.97M  19.7%     Michael Trizna, NMNH/BOL - triznam

Volume=GPFS:scratch_public, mounted as /scratch/public
                     --  disk   --     --  #files --     default quota: 15.00TB/39.8M
Disk                 usage   %quota    usage  %quota     name, affiliation - username (indiv. quota)
-------------------- ------- ------    ------ ------     -------------------------------------------
/scratch/public      17.20TB 114.7%     2.78M   7.0% *** Ting Wang, NMNH - wangt2
/scratch/public      15.00TB 100.0%     1.72M   4.3% *** Juan Uribe, NMNH - uribeje
/scratch/public      14.00TB  93.3%     0.38M   1.0%     Jose Grau, SCBI - graujh
/scratch/public      13.70TB  91.3%     0.58M   1.5%     Molly Hagemann, NZCBI - hagemannm
/scratch/public      13.60TB  90.7%    10.43M  26.2%     Michael Trizna, NMNH/BOL - triznam
/scratch/public      13.50TB  90.0%     2.32M   5.8%     Solomon Chak, SERC - chaks
/scratch/public      13.30TB  88.7%     0.80M   2.0%     Henrique Figueiro, SCBI - figueiroh
/scratch/public      13.30TB  88.7%     0.56M   1.4%     Herman Wirshing, NMNH/IZ - wirshingh
/scratch/public      13.20TB  88.0%     0.00M   0.0%     Joseph Mancusi, NZCBI - mancusij
/scratch/public      13.20TB  88.0%     4.20M  10.5%     Kevin Mulder, NZP - mulderk
/scratch/public      12.90TB  86.0%     2.53M   6.4%     Zelong Nie, NMNH - niez

Volume=GPFS:scratch_stri_ap, mounted as /scratch/stri_ap
                     --  disk   --     --  #files --     default quota:  5.00TB/12.6M
Disk                 usage   %quota    usage  %quota     name, affiliation - username (indiv. quota)
-------------------- ------- ------    ------ ------     -------------------------------------------
/scratch/stri_ap     19.60TB 392.0%     0.25M   0.0% *** Carlos Arias, STRI - ariasc

Volume=NAS:store_public, mounted as /store/public
                     --  disk   --     --  #files --     default quota:   0.0MB/0.0M
Disk                 usage   %quota    usage  %quota     name, affiliation - username (indiv. quota)
-------------------- ------- ------    ------ ------     -------------------------------------------
/store/public         4.80TB  96.1%        -      -  *** Madeline Bursell, OCIO - bursellm (5.0TB/0M)
/store/public         4.73TB  94.6%        -      -      Zelong Nie, NMNH - niez (5.0TB/0M)
/store/public         4.51TB  90.1%        -      -      Alicia Talavera, NMNH - talaveraa (5.0TB/0M)
/store/public         4.39TB  87.8%        -      -      Mirian Tsuchiya, NMNH/Botany - tsuchiyam (5.0TB/0M)
SSD Usage
  Node   -------------------------- /ssd -------------------------------
  Name     Size   Used  Avail    Use% |   Resd  Avail  Resd% | Resd/Used
 64-18    3.49T  24.6G  3.47T    0.7% |   0.0G  3.49T   0.0% |   0.00
 65-02    3.49T  65.5G  3.43T    1.8% |   0.0G  3.49T   0.0% |   0.00
 65-03    3.49T  64.5G  3.43T    1.8% |   0.0G  3.49T   0.0% |   0.00
 65-04    3.49T  65.5G  3.43T    1.8% |   0.0G  3.49T   0.0% |   0.00
 65-05    3.49T  64.5G  3.43T    1.8% |   0.0G  3.49T   0.0% |   0.00
 65-06    3.49T  63.5G  3.43T    1.8% |   0.0G  3.49T   0.0% |   0.00
 65-07    3.49T  24.6G  3.47T    0.7% |   0.0G  3.49T   0.0% |   0.00
 65-10    1.75T  62.5G  1.68T    3.5% |   0.0G  1.75T   0.0% |   0.00
 65-11    1.75T  52.2G  1.69T    2.9% |   0.0G  1.75T   0.0% |   0.00
 65-12    1.75T  12.3G  1.73T    0.7% |   0.0G  1.75T   0.0% |   0.00
 65-13    1.75T  53.2G  1.69T    3.0% |   0.0G  1.75T   0.0% |   0.00
 65-14    1.75T  53.2G  1.69T    3.0% |   0.0G  1.75T   0.0% |   0.00
 65-15    1.75T  12.3G  1.73T    0.7% |   0.0G  1.75T   0.0% |   0.00
 65-16    1.75T  53.2G  1.69T    3.0% |   0.0G  1.75T   0.0% |   0.00
 65-17    1.75T  12.3G  1.73T    0.7% |   0.0G  1.75T   0.0% |   0.00
 65-18    1.75T  90.1G  1.66T    5.0% | 199.7G  1.55T  11.2% |   2.22
 65-19    1.75T  53.2G  1.69T    3.0% |   0.0G  1.75T   0.0% |   0.00
 65-20    1.75T 159.7G  1.59T    8.9% |   0.0G  1.75T   0.0% |   0.00
 65-21    1.75T  53.2G  1.69T    3.0% |   0.0G  1.75T   0.0% |   0.00
 65-22    1.75T  53.2G  1.69T    3.0% |   0.0G  1.75T   0.0% |   0.00
 65-23    1.75T  53.2G  1.69T    3.0% |   0.0G  1.75T   0.0% |   0.00
 65-24    1.75T  52.2G  1.69T    2.9% |   0.0G  1.75T   0.0% |   0.00
 65-25    1.75T  52.2G  1.69T    2.9% |   0.0G  1.75T   0.0% |   0.00
 65-26    1.75T  52.2G  1.69T    2.9% |   0.0G  1.75T   0.0% |   0.00
 65-27    1.75T  53.2G  1.69T    3.0% |   0.0G  1.75T   0.0% |   0.00
 65-28    1.75T  12.3G  1.73T    0.7% |   0.0G  1.75T   0.0% |   0.00
 65-29    1.75T  52.2G  1.69T    2.9% |   0.0G  1.75T   0.0% |   0.00
 65-30    1.75T  54.3G  1.69T    3.0% |   0.0G  1.75T   0.0% |   0.00
 75-01    5.24T  78.8G  5.16T    1.5% |   0.0G  5.24T   0.0% |   0.00
 75-03    6.98T  90.1G  6.89T    1.3% |   0.0G  6.98T   0.0% |   0.00
 75-04    6.98T  90.1G  6.89T    1.3% |   0.0G  6.98T   0.0% |   0.00
 75-05    6.98T  50.2G  6.93T    0.7% |   0.0G  6.98T   0.0% |   0.00
 75-06    6.98T  50.2G  6.93T    0.7% |   0.0G  6.98T   0.0% |   0.00
 76-01    1.75T  12.3G  1.73T    0.7% |   0.0G  1.75T   0.0% |   0.00
 76-03    1.75T  53.2G  1.69T    3.0% |   0.0G  1.75T   0.0% |   0.00
 76-04    1.75T  52.2G  1.69T    2.9% |   0.0G  1.75T   0.0% |   0.00
 76-05    1.75T  53.2G  1.69T    3.0% |   0.0G  1.75T   0.0% |   0.00
 76-06    1.75T  96.3G  1.65T    5.4% |   0.0G  1.75T   0.0% |   0.00
 76-07    1.75T  12.3G  1.73T    0.7% |   0.0G  1.75T   0.0% |   0.00
 76-08    1.75T  94.2G  1.65T    5.3% |   0.0G  1.75T   0.0% |   0.00
 76-09    1.75T  93.2G  1.65T    5.2% |   0.0G  1.75T   0.0% |   0.00
 76-10    1.75T  53.2G  1.69T    3.0% |   0.0G  1.75T   0.0% |   0.00
 76-11    1.75T  53.2G  1.69T    3.0% |   0.0G  1.75T   0.0% |   0.00
 76-12    1.75T  12.3G  1.73T    0.7% |   0.0G  1.75T   0.0% |   0.00
 76-13    1.75T  99.3G  1.65T    5.6% |   0.0G  1.75T   0.0% |   0.00
 76-14    1.75T  55.3G  1.69T    3.1% |   0.0G  1.75T   0.0% |   0.00
 79-01    7.28T  51.2G  7.22T    0.7% |   0.0G  7.28T   0.0% |   0.00
 79-02    7.28T  51.2G  7.22T    0.7% |   0.0G  7.28T   0.0% |   0.00
 93-06    1.64T  11.3G  1.62T    0.7% |   0.0G  1.64T   0.0% |   0.00
         ---------------------------------------------------------------
 Total   133.1T  2.63T 130.5T    2.0% | 199.7G 132.9T   0.1% |   0.07
Note: the disk usage and the quota report are compiled 4x/day, the SSD usage is updated every 10m.