Hydra-7@ADC Status
|
Hydra has been moved to the new data center, updates are at the
Data Center Move page. You can view the list of all the available modules: as an HTML document, or a plain ASCII text file. You can also check the bandwidth between SAO and HDC. You can select to have this page refreshed every 5m, 20m, or 1hr, this one will auto-refresh every 1hr. |
-
Usage
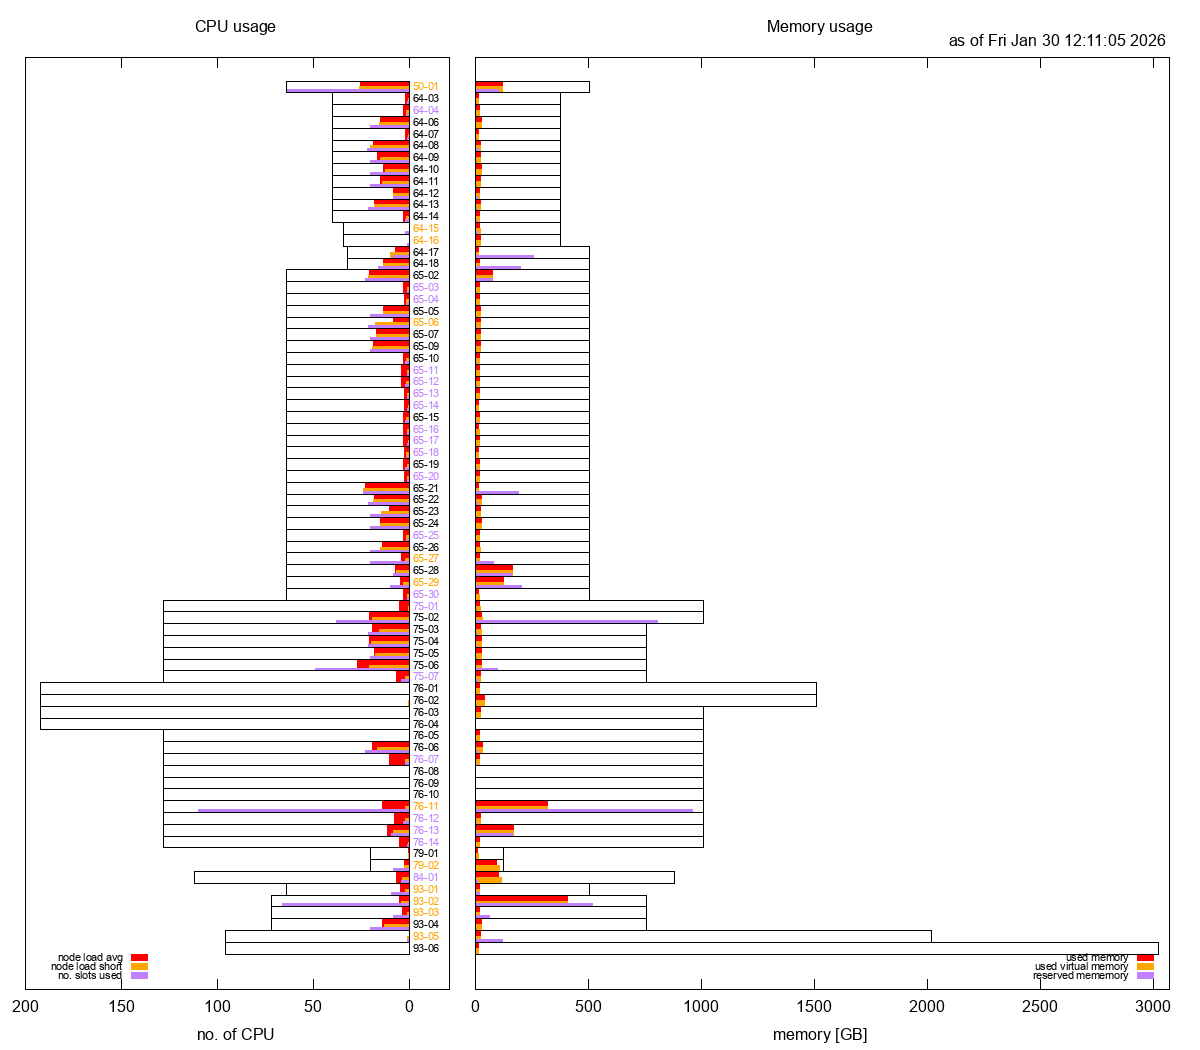
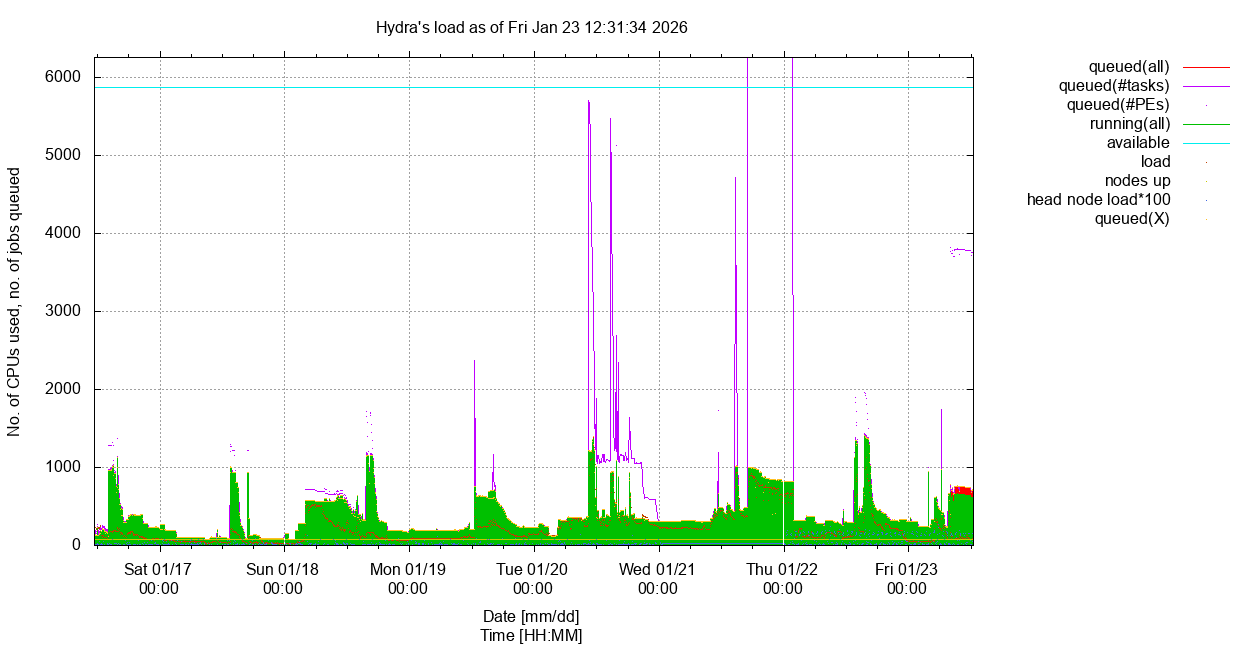
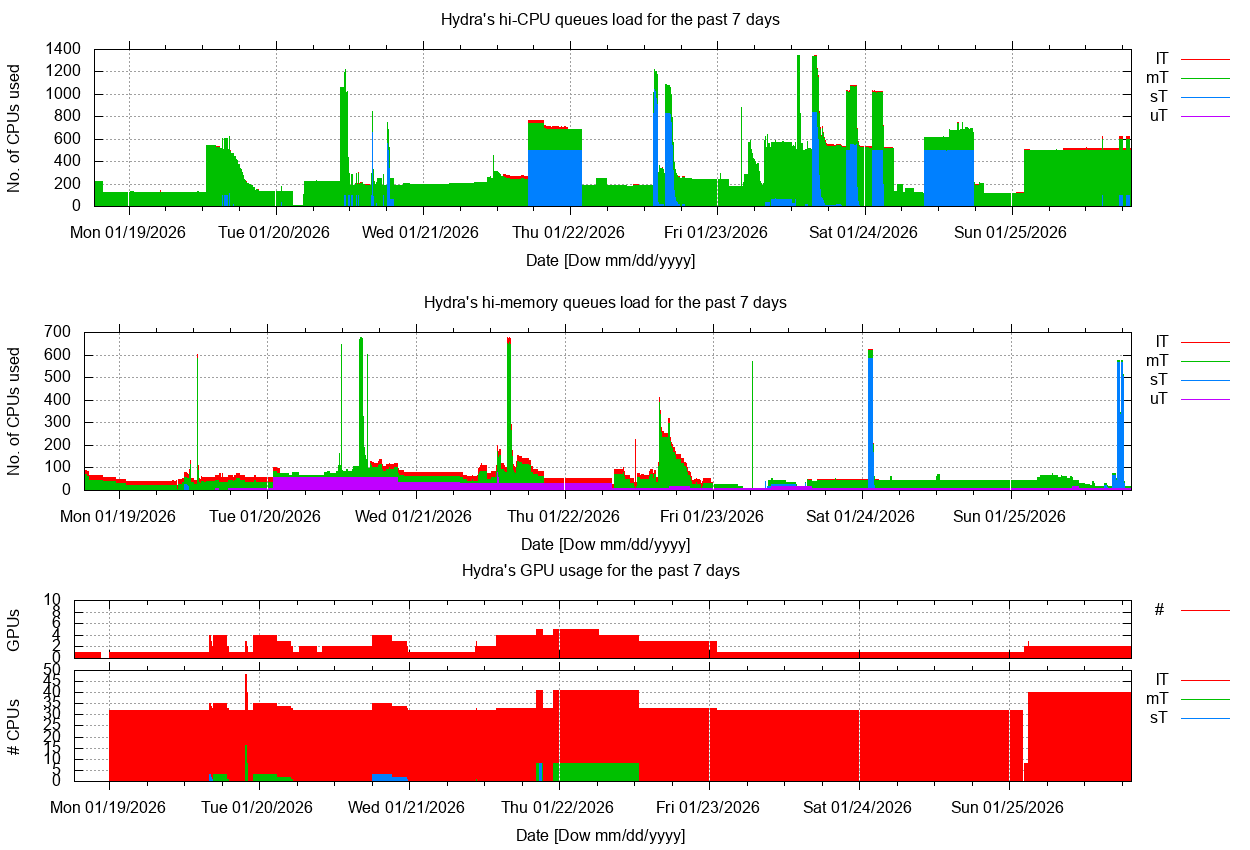
Current snapshot sorted by nodes' . Usage vs time, for length= and user= highlighted.
As of Sat May 16 12:27:03 2026: #CPUs/nodes 5372/74, 3 down.
Loads: head node: 0.37, login nodes: 0.37, 0.18, 2.10, 0.27; NSDs: 0.20, 0.00, 0.07, 3.00, 3.65; licenses: none used.
Queues status: 14 disabled, 14 need attention, none in error state.
18 users with running jobs (slots/jobs):
Current load: 570.0, #running (slots/jobs): 870/36, usage: 16.2%, efficiency: 65.5%
no job in any of the queues.
68 users have/had running or queued jobs over the past 7 days, 92 over the past 15 days. 108 over the past 30 days.
Click on the tabs to view each section, on the plots to view larger versions.
You can view the current cluster snapshot sorted by name, no. cpu, usage, load or memory, and
view the past load for 7, or 15, or 30 days as well as highlight a given user by selecting the corresponding options in the drop down menus.{}
This page was last updated on Saturday, 16-May-2026 12:31:53 EDT with mk-webpage.pl ver. 7.3/1 (Oct 2025/SGK) in 0:47. -
Warnings
Oversubscribed Jobs
As of Sat May 16 12:27:04 EDT 2026 (5 oversubscribed jobs, showing no more than 3 per user)

Total running (PEs/jobs) = 870/36, 0 queued (job), showing only oversubscribed jobs (cpu% > 133% & age > 1h) for all users.
     jobID name            user                age nPEs      cpu% queue     node taskID
  14351360 align_bismark_n mancusij          +2:13    8    347.2% lThM.q   65-13
  14353758 align_bismark_n mancusij          +1:20    8    360.8% lThM.q   65-16
  14353760 align_bismark_n mancusij          +1:20    8    331.3% lThM.q   76-14
  14363651 beast2_tree     uribeje           11:47    8    380.7% uThM.q   65-05
  14363652 beast2_tree4    uribeje           11:45    4    283.7% uThM.q   65-14

⇒ Equivalent to 88.9 overused CPUs: 36 CPUs used at 347.1% on average.
Inefficient Jobs
As of Sat May 16 12:27:04 EDT 2026 (15 inefficient jobs, showing no more than 3 per user)

Total running (PEs/jobs) = 870/36, 0 queued (job), showing only inefficient jobs (cpu% < 33% & age > 1h) for all users.
     jobID name            user                age nPEs      cpu% queue     node taskID
  12804788 IQ_50p_iqtree   morrisseyd       +44:04   64     17.8% lThC.q   76-03
  13993447 earlgrey        zhangy            +9:15   12     28.4% lThM.q   65-10     13
  14230685 iqtree.50p.oct2 cerqueirat        +6:16   12     16.9% lThM.q   65-21
  14346767 make_plink.job  beckerm           +4:00    8     11.7% mThM.q   65-25
  14348022 bears           atkinsonga        +3:19    1      0.1% lTWFM.sq 64-16
  14359955 dxy_windowed_wi figueiroh         +1:03   16      6.2% mThC.q   65-21      2
  14359955 dxy_windowed_wi figueiroh         +1:03   16      6.2% mThC.q   65-20      3
  14359955 dxy_windowed_wi figueiroh         +1:03   16      6.2% mThC.q   75-06      5
  14363074 test            campanam          21:41    1      1.2% lTWFM.sq 64-15
  14363119 admixture_brach ramosi            20:20   10     10.0% lThM.q   84-01
  14363150 acantho-75p-may vagac             19:08   48     13.4% mThC.q   76-07
  14363649 xsinG           uribeje           11:59   20      5.0% lThM.q   75-05
  14363653 xmigra          uribeje           11:25   20      5.0% lThM.q   76-06
  14363709 sra_download    bourkeb           03:52   32      0.2% mThM.q   93-04
  14363737 p2_strict       niez              02:24    6     16.6% mThC.q   65-26

⇒ Equivalent to 250.8 underused CPUs: 282 CPUs used at 11.1% on average.
Nodes with Excess Load
As of Sat May 16 12:27:05 EDT 2026 (5 nodes have a high load, offset=1.5)

                #slots        excess
    node  #CPUs   used   load   load
 -----------------------------------
   65-05     64      8   27.1   19.1 *
   65-13     64      8   35.4   27.4 *
   65-14     64      4   11.4    7.4 *
   65-16     64      8   35.5   27.5 *
   76-14    128      8   33.1   25.1 *

         Total excess load = 106.6
High Memory Jobs
Statistics
  User                     nSlots       memory        memory         vmem     maxvmem   ratio
  Name                      used        reserved      used           used     used [TB] resd/maxvm
--------------------------------------------------------------------------------------------------
  uribeje                 52  28.6%  1.3594  47.0%   0.2003  72.5%   0.2005   0.2005       6.8
  longk                   32  17.6%  0.5625  19.5%   0.0116   4.2%   0.0146   0.1273       4.4
  bourkeb                 32  17.6%  0.5000  17.3%   0.0001   0.0%   0.0001   0.0001    4519.6
  zhangy                  12   6.6%  0.1875   6.5%   0.0034   1.2%   0.0014   0.0787       2.4
  beckerm                  8   4.4%  0.1562   5.4%   0.0153   5.5%   0.0249   0.0253       6.2
  cerqueirat              12   6.6%  0.0586   2.0%   0.0255   9.2%   0.0271   0.0271       2.2
  mancusij                24  13.2%  0.0586   2.0%   0.0101   3.7%   0.4111   0.4112       0.1
  ramosi                  10   5.5%  0.0078   0.3%   0.0100   3.6%   0.0049   0.0210       0.4
==================================================================================================
  Total                  182         2.8906          0.2764          0.6846   0.8911       3.2
Warnings
12 high memory jobs produced a warning:
    1 for beckerm
    1 for cerqueirat
    1 for longk
    3 for mancusij
    1 for ramosi
    4 for uribeje
    1 for zhangy
Details for each job can be found here.
-
Breakdown by Queue
Select length:
Current Usage by Queue
Total Limit Fill factor Efficiency sThC.q=0 mThC.q=510 lThC.q=176 uThC.q=0 686 4976 13.8% 83.0% sThM.q=0 mThM.q=72 lThM.q=98 uThM.q=12 182 4680 3.9% 291.7% sTgpu.q=0 mTgpu.q=0 lTgpu.q=0 qgpu.iq=0 0 104 0.0% uTxlM.rq=0 0 352 0.0% lThMuVM.tq=0 0 384 0.0% lTb2g.q=0 0 2 0.0% lTIO.sq=0 0 8 0.0% lTWFM.sq=2 2 4 50.0% 0.3% qrsh.iq=0 0 68 0.0% Total: 870
-
Avail Slots/Wait Job(s)
Available Slots
As of Sat May 16 12:27:04 EDT 2026

4364 avail(slots), free(load)=5224.9, unresd(mem)=33935.3G, for hgrp=@hicpu-hosts and minMem=1.0G/slot
  total(nCPU)      5232 total(mem)   40.6T
  unused(slots)    4364 unused(load) 5224.9  ie:  83.4%  99.9%
  unreserved(mem) 33.1T unused(mem)  38.4T  ie:  81.7%  94.7%
  unreserved(mem)  7.8G unused(mem)   9.0G per unused(slots)

3996 avail(slots), free(load)=4770.0, unresd(mem)=31595.3G, for hgrp=@himem-hosts and minMem=1.0G/slot
  total(nCPU)      4776 total(mem)   37.7T
  unused(slots)    3996 unused(load) 4770.0  ie:  83.7%  99.9%
  unreserved(mem) 30.9T unused(mem)  35.9T  ie:  81.7%  95.0%
  unreserved(mem)  7.9G unused(mem)   9.2G per unused(slots)

304 avail(slots), free(load)=351.9, unresd(mem)=4655.1G, for hgrp=@xlmem-hosts and minMem=1.0G/slot
  total(nCPU)       352 total(mem)    4.9T
  unused(slots)     304 unused(load) 351.9  ie:  86.4% 100.0%
  unreserved(mem)  4.5T unused(mem)   4.4T  ie:  92.4%  90.3%
  unreserved(mem) 15.3G unused(mem)  15.0G per unused(slots)

104 avail(slots), free(load)=104.0, unresd(mem)=754.2G, for hgrp=@gpu-hosts and minMem=1.0G/slot
  total(nCPU)       104 total(mem)    0.7T
  unused(slots)     104 unused(load) 104.0  ie: 100.0% 100.0%
  unreserved(mem)  0.7T unused(mem)   0.7T  ie: 100.0%  94.8%
  unreserved(mem)  7.3G unused(mem)   6.9G per unused(slots)
GPU Usage
Sat May 16 12:27:10 EDT 2026
hostgroup: @gpu-hosts (3 hosts)
                - --- memory (GB) ----  -  #GPU - --------- slots/CPUs ---------
hostname        -   total   used   resd -  a/u  - nCPU used   load - free unused
compute-50-01   -   503.3   17.2  486.1 -  4/0  -   64    0    0.2 -   64   63.8
compute-79-01   -   125.5   10.9  114.6 -  2/0  -   20    0    0.0 -   20   20.0
compute-79-02   -   125.5   11.2  114.3 -  2/0  -   20    0    0.1 -   20   19.9

Total GPU=8, used=0 (0.0%)
Waiting Job(s)
As of Sat May 16 12:27:05 EDT 2026
Overall Quota Usage
 quota rule           resource=value/limit             %used
 -------------------  -------------------------------  ------
 total_slots/1             slots=870/5960                    14.6% for *
 total_mem_res/1           mem_res=4.533T/39.94T             11.3% for * in queue uThC.q
 blast2GO/1                slots=10/110                       9.1% for *
 total_mem_res/2           mem_res=2.891T/35.78T              8.1% for * in queue uThM.q
-
Memory Usage
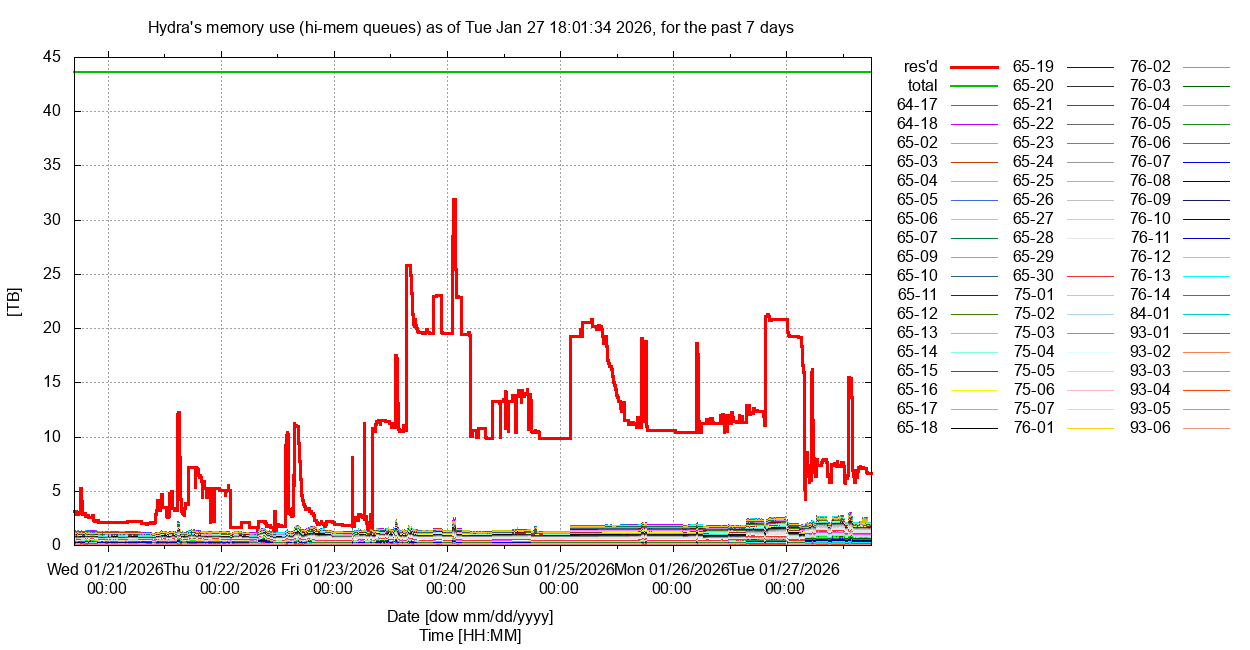
Reserved Memory, All High-Memory Queues
Select length:
Current Memory Quota Usage
As of Sat May 16 12:27:05 EDT 2026

quota rule                resource=value/limit              %used filter
---------------------------------------------------------------------------------------------------
total_mem_res/1           mem_res=4.533T/39.94T             11.3% for * in queue uThC.q
total_mem_res/2           mem_res=2.891T/35.78T              8.1% for * in queue uThM.q
Current Memory Usage by Compute Node, High Memory Nodes Only
hostgroup: @himem-hosts (56 hosts)
                - ----------- memory (GB) ------------  - --------- slots/CPUs ---------
hostname        -   avail   used   resd - unused unresd - nCPU used   load - free unused
compute-64-17   -   503.5   10.4    0.2 -  493.1  503.3 -   32    0    0.0 -   32   32.0
compute-64-18   -   503.5   10.4    0.2 -  493.1  503.3 -   32    0    0.0 -   32   32.0
compute-65-02   -   503.5   26.5    8.0 -  477.0  495.5 -   64    8    7.6 -   56   56.4
compute-65-03   -   503.5   17.2    0.0 -  486.3  503.5 -   64    0    0.0 -   64   64.0
compute-65-04   -   503.5   15.3    0.0 -  488.2  503.5 -   64    0    0.0 -   64   64.0
compute-65-05   -   503.5   24.1  128.0 -  479.4  375.5 -   64    8   28.4 -   56   35.6
compute-65-06   -   503.5   16.0    0.0 -  487.5  503.5 -   64    0    0.1 -   64   63.9
compute-65-07   -   503.5   16.1    0.0 -  487.4  503.5 -   64    0    0.0 -   64   64.0
compute-65-09   -   503.5   11.1    0.0 -  492.4  503.5 -   64    0    0.0 -   64   64.0
compute-65-10   -   503.5   19.5  192.0 -  484.0  311.5 -   64   12    9.5 -   52   54.5
compute-65-11   -   503.5   10.6    0.0 -  492.9  503.5 -   64    0    0.0 -   64   64.0
compute-65-12   -   503.5   16.8    0.0 -  486.7  503.5 -   64    0    0.0 -   64   64.0
compute-65-13   -   503.5  133.1   20.0 -  370.4  483.5 -   64    8   35.4 -   56   28.6
compute-65-14   -   503.5   38.4   64.0 -  465.1  439.5 -   64    4   11.4 -   60   52.6
compute-65-15   -   503.5   18.5    0.0 -  485.0  503.5 -   64    0    0.0 -   64   64.0
compute-65-16   -   503.5  128.5   20.0 -  375.0  483.5 -   64    8   35.5 -   56   28.5
compute-65-17   -   503.5   17.5    0.0 -  486.0  503.5 -   64    0    0.0 -   64   64.0
compute-65-18   -   503.5   10.9    0.0 -  492.6  503.5 -   64    0    0.0 -   64   64.0
compute-65-19   -   503.5   17.1    0.0 -  486.4  503.5 -   64    0    0.0 -   64   64.0
compute-65-20   -   503.5   10.9  128.0 -  492.6  375.5 -   64   16    1.0 -   48   63.0
compute-65-21   -   503.5   44.8  188.0 -  458.7  315.5 -   64   28    3.2 -   36   60.8
compute-65-22   -   503.5   19.9  384.0 -  483.6  119.5 -   64   48   46.3 -   16   17.7
compute-65-23   -   503.5   10.5    0.0 -  493.0  503.5 -   64    0    0.1 -   64   63.9
compute-65-24   -   503.5   17.5    0.0 -  486.0  503.5 -   64    0    0.0 -   64   64.0
compute-65-25   -   503.5   39.3  160.0 -  464.2  343.5 -   64    8    1.4 -   56   62.6
compute-65-26   -   503.5   11.9   48.0 -  491.6  455.5 -   64    6    1.0 -   58   63.0
compute-65-27   -   503.5   31.0  384.0 -  472.5  119.5 -   64   48   46.0 -   16   18.0
compute-65-28   -   503.5   18.3    0.0 -  485.2  503.5 -   64    0    0.0 -   64   64.0
compute-65-29   -   503.5   25.8   64.0 -  477.7  439.5 -   64    8    7.3 -   56   56.6
compute-65-30   -   503.5   17.6    0.0 -  485.9  503.5 -   64    0    0.0 -   64   64.0
compute-75-01   -  1007.5   87.6  256.1 -  919.9  751.4 -  128   64   47.5 -   64   80.5
compute-75-02   -  1007.5   38.8  384.0 -  968.7  623.5 -  128   48   46.6 -   80   81.4
compute-75-03   -   755.5   32.1  384.0 -  723.4  371.5 -  128   48   42.1 -   80   85.9
compute-75-04   -   755.5   44.3  384.0 -  711.2  371.5 -  128   48    8.1 -   80  119.9
compute-75-05   -   755.5   11.6  600.0 -  743.9  155.5 -  128   20    1.0 -  108  127.0
compute-75-06   -   755.5   18.3  128.0 -  737.2  627.5 -  128   16    1.0 -  112  127.0
compute-75-07   -   755.5   36.4  384.0 -  719.1  371.5 -  128   48   23.7 -   80  104.3
compute-76-03   -  1007.4   76.9  256.5 -  930.5  750.9 -  128   64   11.6 -   64  116.4
compute-76-04   -  1007.4   19.2    0.0 -  988.2 1007.4 -  128    0    0.2 -  128  127.8
compute-76-05   -  1007.4   25.2    0.0 -  982.2 1007.4 -  128    0    0.1 -  128  128.0
compute-76-06   -  1007.4   20.4  600.0 -  987.0  407.4 -  128   20    1.1 -  108  126.9
compute-76-07   -  1007.4  275.7  384.0 -  731.7  623.4 -  128   48    5.3 -   80  122.7
compute-76-08   -  1007.4   27.2    2.0 -  980.2 1005.4 -  128    8    8.1 -  120  119.9
compute-76-09   -  1007.4   20.3    0.0 -  987.1 1007.4 -  128    0    0.0 -  128  128.0
compute-76-10   -  1007.4   12.9    0.0 -  994.5 1007.4 -  128    0    0.0 -  128  128.0
compute-76-11   -  1007.4   28.3    8.0 -  979.1  999.4 -  128    8    7.3 -  120  120.7
compute-76-12   -  1007.4   19.3    0.0 -  988.1 1007.4 -  128    0    0.1 -  128  127.9
compute-76-13   -  1007.4   33.6  384.0 -  973.8  623.4 -  128   48   47.9 -   80   80.1
compute-76-14   -  1007.4  129.0   20.0 -  878.4  987.4 -  128    8   33.1 -  120   94.9
compute-84-01   -   881.1  101.5    8.0 -  779.6  873.1 -  112   10    1.0 -  102  111.0
compute-93-01   -   503.8   17.7    0.0 -  486.1  503.8 -   64    0    0.1 -   64   64.0
compute-93-02   -   755.6   17.9  576.0 -  737.7  179.6 -   72   32   11.1 -   40   60.9
compute-93-03   -   755.6   10.7    0.0 -  744.9  755.6 -   72    0    0.0 -   72   72.0
compute-93-04   -   755.6   18.7  512.0 -  736.9  243.6 -   72   32    0.0 -   40   72.0
compute-93-05   -  2016.3   11.1    0.0 - 2005.2 2016.3 -   96    0    0.1 -   96   95.9
                   ======= ===== ======                   ==== ====  =====
Totals             38654.3 1940.2 7059.0                   4776  780  531.3
                       ==>   5.0%  18.3%                  ==>  16.3%  11.1%
Most unreserved/unused memory (2016.3/2005.2GB) is on compute-93-05 with 96/95.9 slots/CPUs free/unused.

hostgroup: @xlmem-hosts (4 hosts)
                - ----------- memory (GB) ------------  - --------- slots/CPUs ---------
hostname        -   avail   used   resd - unused unresd - nCPU used   load - free unused
compute-76-01   -  1511.4  109.8  384.0 - 1401.6 1127.4 -  192   48   27.0 -  144  165.0
compute-76-02   -  1511.4  366.1   -0.0 - 1145.3 1511.4 -  192    0    1.1 -  192  190.9
compute-93-05   -  2016.3   11.1    0.0 - 2005.2 2016.3 -   96    0    0.1 -   96   95.9
                   ======= ===== ======                   ==== ====  =====
Totals             5039.1  487.0  384.0                    480   48   28.2
                       ==>   9.7%   7.6%                  ==>  10.0%   5.9%
Most unreserved/unused memory (2016.3/2005.2GB) is on compute-93-05 with 96/95.9 slots/CPUs free/unused.
Past Memory Usage vs Memory Reservation
Past memory use in hi-mem queues between 05/06/26 and 05/13/26
queues: ?ThM.q
                ----------- total ---------  -------------------- mean --------------------
user                 no. of    elapsed time   eff. reserved  maxvmem  average  ratio
name                jobs/slots     [d]        [%]     [GB]     [GB]     [GB]   resd/maxvmem
--------------- -------------- ------------ ----- --------- -------- --------- ------------
kweskinm               2/2          0.00    199.7     16.0      0.0      0.0      0.0
xuj                    1/8          0.00      1.9     40.0      2.0      1.3     20.3 > 2.5
capadorhd             11/44         0.00     99.5     64.0     31.1      0.3      2.1
jourdain-fievetl       2/2          0.01    101.7     24.0     20.3     20.0      1.2
pappalardop            1/1          0.02     99.7    200.0      0.6      0.5    332.2 > 2.5
cerqueirat             6/17         0.08     99.7     32.0      3.6      1.6      8.9 > 2.5
johnsonsj            140/280        0.11     97.2     40.0      5.3      1.9      7.6 > 2.5
bourkeb               10/120        0.13     80.7    502.6    340.0      8.7      1.5
macdonaldk            12/240        0.15     47.1    200.0     94.7      6.9      2.1
breusingc              3/48         0.23     72.3      0.2    107.5     32.8      0.0
mancusij              12/45         0.26    202.4     23.2     16.8      3.3      1.4
niez                  16/64         0.26     29.3     63.4     10.0      9.5      6.3 > 2.5
longk                  3/96         0.35     34.8    256.0     92.3     12.4      2.8 > 2.5
sbeaudry              17/69         0.47     86.5     26.1      5.9      4.9      4.4 > 2.5
santosbe               5/142        0.57     35.3    750.1     31.5      7.0     23.8 > 2.5
mghahrem              27/37         0.63     93.8    190.4      5.6      3.3     33.9 > 2.5
kratmans              53/636        0.65     81.0    278.8     17.9      8.5     15.6 > 2.5
athalappila         1049/7409       0.70     14.5     66.8      5.2      0.1     12.9 > 2.5
pradon                 8/512        0.70     53.4     12.0    215.3    133.0      0.1
jhora                 20/398        1.25     80.3    252.4     66.3      1.6      3.8 > 2.5
whiteae                2/2          1.32     96.7     64.0     26.2     18.2      2.4
campanam             125/513        1.46    100.8     26.2      8.9      3.4      2.9 > 2.5
atkinsonga           397/686        1.79    126.1     92.0     64.4     38.5      1.4
vohsens             2477/2477       1.89     96.4     16.0      0.4      0.2     45.4 > 2.5
szieba                80/4128       2.76     47.6      0.0    766.6     43.5      0.0
girardmg             819/2187       7.01     41.4     80.8     24.5      4.2      3.3 > 2.5
collinsa             323/3776       7.67     79.7    142.9     19.6      8.2      7.3 > 2.5
quattrinia          9111/9111       9.40     92.6     16.0      2.2      1.3      7.2 > 2.5
nelsonjo           24157/24157      9.41     54.2     16.0      1.3      0.7     12.6 > 2.5
uribeje               78/833       10.47     74.7    296.8     23.8      2.2     12.5 > 2.5
horowitzj           5892/5997      14.23     95.8     21.3      3.9      2.1      5.5 > 2.5
beckerm               42/336       14.33     20.4    125.8     25.9     12.9      4.9 > 2.5
macguigand          5099/19580     30.05     38.5     89.9     19.5      3.1      4.6 > 2.5
zhangy                29/356       42.86     45.4    201.6    181.6      2.0      1.1
--------------- -------------- ------------ ----- --------- -------- --------- ------------
all                50029/84309    161.22     56.4    125.1     74.9      5.4      1.7
---
queues: ?TxlM.rq
                ----------- total ---------  -------------------- mean --------------------
user                 no. of    elapsed time   eff. reserved  maxvmem  average  ratio
name                jobs/slots     [d]        [%]     [GB]     [GB]     [GB]   resd/maxvmem
--------------- -------------- ------------ ----- --------- -------- --------- ------------
--------------- -------------- ------------ ----- --------- -------- --------- ------------
all                    0/0          0.00
-
Resource Limits
    Limit slots for all users together
    users * to slots=5960
    users * queues sThC.q,lThC.q,mThC.q,uThC.q to slots=5176
    users * queues sThM.q,mThM.q,lThM.q,uThM.q to slots=4680
    users * queues uTxlM.rq to slots=536
    users * queues sTgpu.q,mTgpu.q,lTgpu.q to slots=104

    Limit slots/user for all queues
    users {*} to slots=840

    Limit slots/user for hiMem queues
    users {*} queues {sThM.q} to slots=840
    users {*} queues {mThM.q} to slots=585
    users {*} queues {lThM.q} to slots=390
    users {*} queues {uThM.q} to slots=73

    Limit slots/user for xlMem restricted queue
    users {*} queues {uTxlM.rq} to slots=536

    Limit total reserved memory for all users per queue type
    users * queues sThC.q,mThC.q,lThC.q,uThC.q to mem_res=40902G
    users * queues sThM.q,mThM.q,lThM.q,uThM.q to mem_res=36637G
    users * queues uTxlM.rq to mem_res=8063G

    Limit reserved memory per user for specific queues
    users {*} queues sThC.q,mThC.q,lThC.q,uThC.q to mem_res=10225G
    users {*} queues sThM.q,mThM.q,lThM.q,uThM.q to mem_res=9159G
    users {*} queues uTxlM.rq to mem_res=8063G

    Limit slots/user for interactive (qrsh) queues
    users {*} queues {qrsh.iq} to slots=16

    Limit GPUs for all users in GPU queues to the avail no of GPUs
    users * queues {sTgpu.q,mTgpu.q,lTgpu.q,qgpu.iq} to GPUS=8

    Limit GPUs per user in all the GPU queues
    users {*} queues sTgpu.q,mTgpu.q,lTgpu.q,qgpu.iq to GPUS=4

    Limit GPUs per user in each GPU queues
    users {*} queues {sTgpu.q} to GPUS=4
    users {*} queues {mTgpu.q} to GPUS=3
    users {*} queues {lTgpu.q} to GPUS=2
    users {*} queues {qgpu.iq} to GPUS=1

    Limit to set aside a slot for blast2GO
    users * queues !lTb2g.q hosts {@b2g-hosts} to slots=110
    users * queues lTb2g.q hosts {@b2g-hosts} to slots=1
    users {*} queues lTb2g.q hosts {@b2g-hosts} to slots=1

    Limit total number of idl licenses per user
    users {*} to idlrt_license=102

    Limit slots for io queue per user
    users {*} queues {lTIO.sq} to slots=8

    Limit slots for io queue per user
    users {*} queues {lTWFM.sq} to slots=2

    Limit the number of concurrent jobs per user for some queues
    users {*} queues {uTxlM.rq} to no_concurrent_jobs=3
    users {*} queues {lTIO.sq} to no_concurrent_jobs=2
    users {*} queues {lTWFM.sq} to no_concurrent_jobs=1
    users {*} queues {qrsh.iq} to no_concurrent_jobs=4
    users {*} queues {qgpu.iq} to no_concurrent_jobs=1

    Limit slots/user in hiCPU queues
    users {*} queues {sThC.q} to slots=840
    users {*} queues {mThC.q} to slots=640
    users {*} queues {lThC.q} to slots=431
    users {*} queues {uThC.q} to slots=143
-
Disk Usage & Quota
As of Sat May 16 11:06:02 EDT 2026
Disk Usage
Filesystem                              Size     Used    Avail Capacity  Mounted on

netapp-fas83:/vol_home                  22.36T   19.56T    2.80T  88%/13%  /home
netapp-fas83-n02:/vol_data_public      332.50T  118.32T  214.18T  36%/2%   /data/public
gpfs02:public                          800.00T  552.13T  247.87T  70%/36%  /scratch/public
gpfs02:nmnh_bradys                      25.00T   19.83T    5.17T  80%/59%  /scratch/bradys
gpfs02:nmnh_kistlerl                   120.00T   88.82T   31.18T  75%/14%  /scratch/kistlerl
gpfs02:nmnh_meyerc                      25.00T   21.16T    3.84T  85%/8%   /scratch/meyerc
gpfs02:nmnh_corals                      60.00T   55.55T    4.45T  93%/24%  /scratch/nmnh_corals
gpfs02:nmnh_ggi                        130.00T   36.46T   93.54T  29%/15%  /scratch/nmnh_ggi
gpfs02:nmnh_lab                         25.00T   11.45T   13.55T  46%/12%  /scratch/nmnh_lab
gpfs02:nmnh_mammals                     35.00T   28.90T    6.10T  83%/39%  /scratch/nmnh_mammals
gpfs02:nmnh_mdbc                        60.00T   49.48T   10.52T  83%/26%  /scratch/nmnh_mdbc
gpfs02:nmnh_ocean_dna                   90.00T   70.54T   19.46T  79%/5%   /scratch/nmnh_ocean_dna
gpfs02:nzp_ccg                         145.00T   23.18T  121.82T  16%/10%  /scratch/nzp_ccg
gpfs01:ocio_dpo                         10.00T    6.41T    3.59T  65%/1%   /scratch/ocio_dpo
gpfs01:ocio_ids                          5.00T    0.00G    5.00T   0%/1%   /scratch/ocio_ids
gpfs02:pool_kozakk                      12.00T   10.67T    1.33T  89%/2%   /scratch/pool_kozakk
gpfs02:pool_sao_access                  50.00T    4.79T   45.21T  10%/9%   /scratch/pool_sao_access
gpfs02:pool_sao_rtdc                    20.00T  908.33G   19.11T   5%/1%   /scratch/pool_sao_rtdc
gpfs02:sao_atmos                       350.00T  262.03T   87.97T  75%/12%  /scratch/sao_atmos
gpfs02:sao_cga                          25.00T    9.44T   15.56T  38%/28%  /scratch/sao_cga
gpfs02:sao_tess                         50.00T   23.25T   26.75T  47%/70%  /scratch/sao_tess
gpfs02:scbi_gis                        200.00T  141.04T   58.96T  71%/8%   /scratch/scbi_gis
gpfs02:nmnh_schultzt                    35.00T   24.81T   10.19T  71%/75%  /scratch/schultzt
gpfs02:serc_cdelab                      35.00T    8.80T   26.20T  26%/5%   /scratch/serc_cdelab
gpfs02:stri_ap                          25.00T   21.80T    3.20T  88%/2%   /scratch/stri_ap
gpfs01:sao_sylvain                     145.00T   44.64T  100.36T  31%/23%  /scratch/sylvain
gpfs02:usda_sel                         25.00T    9.45T   15.55T  38%/35%  /scratch/usda_sel
gpfs02:wrbu                             50.00T   43.06T    6.94T  87%/14%  /scratch/wrbu
nas1:/mnt/pool/public                  175.00T  105.38T   69.62T  61%/1%   /store/public
nas1:/mnt/pool/nmnh_bradys              40.00T   14.58T   25.42T  37%/1%   /store/bradys
nas2:/mnt/pool/n1p3/nmnh_ggi            90.00T   36.28T   53.72T  41%/1%   /store/nmnh_ggi
nas2:/mnt/pool/nmnh_lab                 40.00T   16.61T   23.39T  42%/1%   /store/nmnh_lab
nas2:/mnt/pool/nmnh_ocean_dna           70.00T   31.93T   38.07T  46%/1%   /store/nmnh_ocean_dna
netapp-fas83-n02:/vol_store_nzp_ccg/n  150.00T  131.09T   18.91T  88%/1%   /store/nzp_ccg
nas2:/mnt/pool/nzp_cec                  40.00T   20.71T   19.29T  52%/1%   /store/nzp_cec
nas2:/mnt/pool/n1p2/ocio_dpo            20.00T   17.20T    2.80T  87%/1%   /store/ocio_dpo
nas2:/mnt/pool/n1p1/sao_atmos          750.00T  435.41T  314.59T  59%/1%   /store/sao_atmos
nas2:/mnt/pool/n1p2/nmnh_schultzt       80.00T   24.96T   55.04T  32%/1%   /store/schultzt
nas1:/mnt/pool/sao_sylvain              50.00T    9.64T   40.36T  20%/1%   /store/sylvain
nas1:/mnt/pool/wrbu                     80.00T   10.02T   69.98T  13%/1%   /store/wrbu
nas1:/mnt/pool/admin                    20.00T    8.05T   11.95T  41%/1%   /store/admin
You can view plots of disk use vs time, for the past 7, 30, or 120 days; as well as plots of disk usage by user, or by device (for the past 90 or 240 days respectively).Notes
Capacity shows % disk space full and % of inodes used.
When too many small files are written on a disk, the file system can become full because it is unable to keep track of new files.
The % of inodes should be lower or comparable to the % of disk space used.
If it is much larger, the disk can become unusable before it gets full.
Disk Quota Report
Volume=NetApp:vol_data_public, mounted as /data/public
                     --  disk   --     --  #files --     default quota:  4.50TB/10.0M
Disk                 usage   %quota    usage  %quota     name, affiliation - username (indiv. quota)
-------------------- ------- ------    ------ ------     -------------------------------------------
/data/public          4.13TB  91.8%     5.07M  50.7%     Alicia Talavera, NMNH - talaveraa

Volume=NetApp:vol_home, mounted as /home
                     --  disk   --     --  #files --     default quota: 384.0GB/10.0M
Disk                 usage   %quota    usage  %quota     name, affiliation - username (indiv. quota)
-------------------- ------- ------    ------ ------     -------------------------------------------
/home                378.6GB  98.6%     0.18M   1.8% *** Paige Byerly, NZP - byerlyp
/home                375.5GB  97.8%     0.09M   0.9% *** Rebeka Tamasi Bottger, SAO/OIR - rbottger
/home                363.6GB  94.7%     0.27M   2.7%     Juan Uribe, NMNH - uribeje
/home                347.4GB  90.5%     2.92M  29.2%     Brian Bourke, WRBU - bourkeb
/home                338.6GB  88.2%     0.27M   2.7%     Paul Cristofari, SAO/SSP - pcristof
/home                329.1GB  85.7%     0.00M   0.0%     Allan Cabrero, NMNH - cabreroa

Volume=GPFS:scratch_public, mounted as /scratch/public
                     --  disk   --     --  #files --     default quota: 15.00TB/39.8M
Disk                 usage   %quota    usage  %quota     name, affiliation - username (indiv. quota)
-------------------- ------- ------    ------ ------     -------------------------------------------
/scratch/public      17.20TB 114.7%     2.78M   7.0% *** Ting Wang, NMNH - wangt2
/scratch/public      14.20TB  94.7%     0.30M   0.8%     Allen G. Collins, NMNH - collinsa
/scratch/public      13.60TB  90.7%    10.41M  26.1%     Michael Trizna, NMNH/BOL - triznam
/scratch/public      13.50TB  90.0%     2.32M   5.8%     Solomon Chak, SERC - chaks
/scratch/public      13.40TB  89.3%     1.69M   4.2%     Juan Uribe, NMNH - uribeje
/scratch/public      13.30TB  88.7%    36.21M  90.9%     Alberto Coello Garrido, NMNH - coellogarridoa
/scratch/public      13.20TB  88.0%    16.12M  40.4%     Brian Bourke, WRBU - bourkeb
/scratch/public      13.20TB  88.0%     4.20M  10.5%     Kevin Mulder, NZP - mulderk
/scratch/public      13.10TB  87.3%    21.77M  54.6%     Zelong Nie, NMNH - niez

Volume=GPFS:scratch_stri_ap, mounted as /scratch/stri_ap
                     --  disk   --     --  #files --     default quota:  5.00TB/12.6M
Disk                 usage   %quota    usage  %quota     name, affiliation - username (indiv. quota)
-------------------- ------- ------    ------ ------     -------------------------------------------
/scratch/stri_ap     19.60TB 392.0%     0.25M   0.0% *** Carlos Arias, STRI - ariasc

Volume=NAS:store_public, mounted as /store/public
                     --  disk   --     --  #files --     default quota:   0.0MB/0.0M
Disk                 usage   %quota    usage  %quota     name, affiliation - username (indiv. quota)
-------------------- ------- ------    ------ ------     -------------------------------------------
/store/public         4.80TB  96.1%        -      -  *** Madeline Bursell, OCIO - bursellm (5.0TB/0M)
/store/public         4.73TB  94.6%        -      -      Zelong Nie, NMNH - niez (5.0TB/0M)
/store/public         4.51TB  90.1%        -      -      Alicia Talavera, NMNH - talaveraa (5.0TB/0M)
/store/public         4.39TB  87.8%        -      -      Mirian Tsuchiya, NMNH/Botany - tsuchiyam (5.0TB/0M)
SSD Usage
  Node   -------------------------- /ssd -------------------------------
  Name     Size   Used  Avail    Use% |   Resd  Avail  Resd% | Resd/Used
 64-18    3.49T  24.6G  3.47T    0.7% |   0.0G  3.49T   0.0% |   0.00
 65-02    3.49T  65.5G  3.43T    1.8% |   0.0G  3.49T   0.0% |   0.00
 65-03    3.49T  64.5G  3.43T    1.8% |   0.0G  3.49T   0.0% |   0.00
 65-04    3.49T  65.5G  3.43T    1.8% |   0.0G  3.49T   0.0% |   0.00
 65-05    3.49T  64.5G  3.43T    1.8% |   0.0G  3.49T   0.0% |   0.00
 65-06    3.49T  63.5G  3.43T    1.8% |   0.0G  3.49T   0.0% |   0.00
 65-07    3.49T  24.6G  3.47T    0.7% |   0.0G  3.49T   0.0% |   0.00
 65-10    1.75T  62.5G  1.68T    3.5% |   0.0G  1.75T   0.0% |   0.00
 65-11    1.75T  52.2G  1.69T    2.9% |   0.0G  1.75T   0.0% |   0.00
 65-12    1.75T  12.3G  1.73T    0.7% |   0.0G  1.75T   0.0% |   0.00
 65-13    1.75T  53.2G  1.69T    3.0% |   0.0G  1.75T   0.0% |   0.00
 65-14    1.75T  53.2G  1.69T    3.0% |   0.0G  1.75T   0.0% |   0.00
 65-15    1.75T  12.3G  1.73T    0.7% |   0.0G  1.75T   0.0% |   0.00
 65-16    1.75T  53.2G  1.69T    3.0% |   0.0G  1.75T   0.0% |   0.00
 65-17    1.75T  53.2G  1.69T    3.0% |   0.0G  1.75T   0.0% |   0.00
 65-18    1.75T  53.2G  1.69T    3.0% |   0.0G  1.75T   0.0% |   0.00
 65-19    1.75T  53.2G  1.69T    3.0% |   0.0G  1.75T   0.0% |   0.00
 65-20    1.75T 159.7G  1.59T    8.9% |   0.0G  1.75T   0.0% |   0.00
 65-21    1.75T  53.2G  1.69T    3.0% |   0.0G  1.75T   0.0% |   0.00
 65-22    1.75T  53.2G  1.69T    3.0% |   0.0G  1.75T   0.0% |   0.00
 65-23    1.75T  53.2G  1.69T    3.0% |   0.0G  1.75T   0.0% |   0.00
 65-24    1.75T  52.2G  1.69T    2.9% |   0.0G  1.75T   0.0% |   0.00
 65-25    1.75T  52.2G  1.69T    2.9% |   0.0G  1.75T   0.0% |   0.00
 65-26    1.75T  52.2G  1.69T    2.9% |   0.0G  1.75T   0.0% |   0.00
 65-27    1.75T  53.2G  1.69T    3.0% |   0.0G  1.75T   0.0% |   0.00
 65-28    1.75T  12.3G  1.73T    0.7% |   0.0G  1.75T   0.0% |   0.00
 65-29    1.75T  52.2G  1.69T    2.9% |   0.0G  1.75T   0.0% |   0.00
 65-30    1.75T  54.3G  1.69T    3.0% |   0.0G  1.75T   0.0% |   0.00
 75-01    5.24T  78.8G  5.16T    1.5% |   0.0G  5.24T   0.0% |   0.00
 75-03    6.98T  90.1G  6.89T    1.3% |   0.0G  6.98T   0.0% |   0.00
 75-04    6.98T  90.1G  6.89T    1.3% |   0.0G  6.98T   0.0% |   0.00
 75-05    6.98T  50.2G  6.93T    0.7% |   0.0G  6.98T   0.0% |   0.00
 75-06    6.98T  90.1G  6.89T    1.3% |   0.0G  6.98T   0.0% |   0.00
 76-01    1.75T  12.3G  1.73T    0.7% |   0.0G  1.75T   0.0% |   0.00
 76-03    1.75T  53.2G  1.69T    3.0% |   0.0G  1.75T   0.0% |   0.00
 76-04    1.75T  52.2G  1.69T    2.9% |   0.0G  1.75T   0.0% |   0.00
 76-05    1.75T  53.2G  1.69T    3.0% |   0.0G  1.75T   0.0% |   0.00
 76-06    1.75T  96.3G  1.65T    5.4% |   0.0G  1.75T   0.0% |   0.00
 76-07    1.75T  12.3G  1.73T    0.7% |   0.0G  1.75T   0.0% |   0.00
 76-08    1.75T  94.2G  1.65T    5.3% |   0.0G  1.75T   0.0% |   0.00
 76-09    1.75T  93.2G  1.65T    5.2% |   0.0G  1.75T   0.0% |   0.00
 76-10    1.75T  53.2G  1.69T    3.0% |   0.0G  1.75T   0.0% |   0.00
 76-11    1.75T  53.2G  1.69T    3.0% |   0.0G  1.75T   0.0% |   0.00
 76-12    1.75T  12.3G  1.73T    0.7% |   0.0G  1.75T   0.0% |   0.00
 76-13    1.75T  99.3G  1.65T    5.6% |   0.0G  1.75T   0.0% |   0.00
 76-14    1.75T  55.3G  1.69T    3.1% |   0.0G  1.75T   0.0% |   0.00
 79-01    7.28T  51.2G  7.22T    0.7% |   0.0G  7.28T   0.0% |   0.00
 79-02    7.28T  51.2G  7.22T    0.7% |   0.0G  7.28T   0.0% |   0.00
 93-06    1.64T -5723.1G  7.22T -341.6% |   0.0G  1.64T   0.0% |   0.00
         ---------------------------------------------------------------
 Total   133.1T -3001.3G 136.0T   -2.2% |   0.0G 133.1T   0.0% |   0.00
Note: the disk usage and the quota report are compiled 4x/day, the SSD usage is updated every 10m.