|
|
|
Quantitative Reasoning 46:
The Visual Display of Quantitative Information
Alyssa A. Goodman
Reading Material:
The main text for this course will be The Visual Display of Quantiative Information, by Edward Tufte. In addition, students will be asked to purchase Tufte's "textbooklet" offering case studies of the 1986 Challenger Disaster and the 1854 London Cholera Epidemic (see below). One additional text, offering a slightly more mathematical perspective than Tufte's works, will also be required. Other works by Tufte will be placed on reserve for the duration of the course, and will be referred to in class and on Project Sets. All selected and cadidate books are listed below.
The Works of Edward Tufte (descriptions excerpted from edwardtufte.com):
|
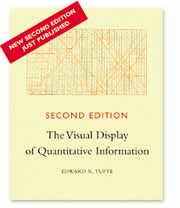
(Required) The Visual Display of Quantitative Information
"The classic book on statistical graphics, charts, tables. Theory and practice in the design of data graphics, 250 illustrations of the best (and a few of the worst) statistical graphics, with detailed analysis of how to display data for precise, effective, quick analysis. Design of the high-resolution displays, small multiples. Editing and improving graphics. The data-ink ratio. Time-series, relational graphics, data maps, multivariate designs. Detection of graphical deception: design variation vs. data variation. Sources of deception. Aesthetics and data graphical displays.
(The [book now available for purchase] is the second edition of The Visual Display of Quantitative Information. Recently published, this new edition provides excellent color reproductions of the many graphics of William Playfair, adds color to other images, and includes all the changes and corrections accumulated during 17 printings of the first edition.)"
|
|
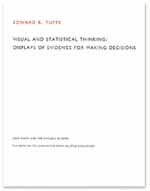
(Required) Visual and Statistical Thinking "Textbooklet"
"This inexpensive booklet reprints, in full color, chapter 2 of Visual Explanations, analyzing a cholera epidemic in London in 1854 and the evidence used to decide to launch the space shuttle Challenger. Topics include cause and effect, data errors and credibility, evidence selection, and statistical graphics. For teaching data analysis and evidence in decision-making."
|
|
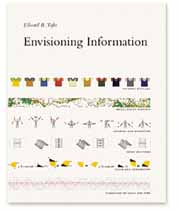
(Reserve) Envisioning Information
"This book celebrates escapes from the flatlands of both paper and computer screen, showing superb displays of high-dimensional complex data. The most design-oriented of Edward Tufte's books, Envisioning Information shows maps, charts, scientific presentations, diagrams, computer interfaces, statistical graphics and tables, stereo photographs, guidebooks, courtroom exhibits, timetables, use of color, a pop-up, and many other wonderful displays of information. The book provides practical advice about how to explain complex material by visual means, with extraordinary examples to illustrate the fundamental principles of information displays. Topics include escaping flatland, color and information, micro/macro designs, layering and separation, small multiples, and narratives. Winner of 17 awards for design and content. 400 illustrations with exquisite 6- to 12-color printing throughout. Highest quality design and production."
|
|
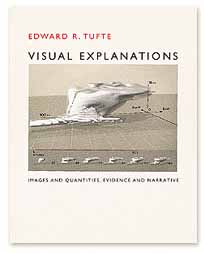
(Reserve) Visual Explanations: Images and Quantities, Evidence and Narrative
"This book is about pictures of verbs, the representation of mechanism and motion, process and dynamics, causes and effects, explanation and narrative. Practical applications and examples include statistical graphics, charts for making important decisions in engineering and medicine, technical manuals, diagrams, design of computer interfaces and websites and on-line manuals, animations and scientific visualizations, techniques for talks, and design strategies for enhancing the rate of information transfer in print, presentations, and computer screens. The use of visual evidence in deciding to launch the space shuttle Challenger is discussed in careful detail. Video snapshots show redesigns of a supercomputer animation of a thunderstorm. The book is designed and printed to the highest standards, with luscious color throughout and four built-in flaps for showing motion and before/after effects."
|
Candidate Additional Texts, Now Under Review
- Information Graphics : A Comprehensive Illustrated Reference, Robert L. Harris
- Digital Diagrams: How to Design and Present Statistical Information Effectively, Trevor Bounford, Alastair Campbell
- How to Lie With Charts, Gerald E. Jones
- The Universe Unveiled : Instruments and Images Through History, Bruce Stephenson(Editor), et al
Other materials likely to be put on reserve
- Visual Statistics, Jack R. Fraenkel, et al
- Don't Make Me Think: Common Sense Approach to Web Usability, Steve Krug, Roger Black
- The Mapping of the Heavens, Peter Whitfield
- Information Anxiety 2, David Sume, Loring Leifer, Richard Saul Wurman
|

![[red bar]](red_long.gif)
![[AG Home]](/images/ag-home.gif)
![[AG Search]](/images/ag-search.gif)
![[AG Contact]](/images/ag-contact.gif)