


Next: FLAGGING DATA
Up: Demonstration
Previous: INSPECTION OF SPECTRAL DATA
The Miriad task uvplt
can plot a variety of quantities from
visibility data for each baseline, which is a useful application tool for users
to identify bad data points. A feature of color-coded for sources has
been added to the task smauvplt. For polarization data,
color index used for polarization components in the original code
uvplt
conflicts with the color index for source in some cases.
For non-polarization data, smauvplt
has an advantage to
identify bad data points in a multiple source file. Here is an example
to plot the visibilities versus time by selecting the baselines
related to antenna 4:
Task: smauvplt
vis = gc_rx1.lsb.tsys
select = ant(4)
axis = time,ampl
yrange = -10,250
device = /xs
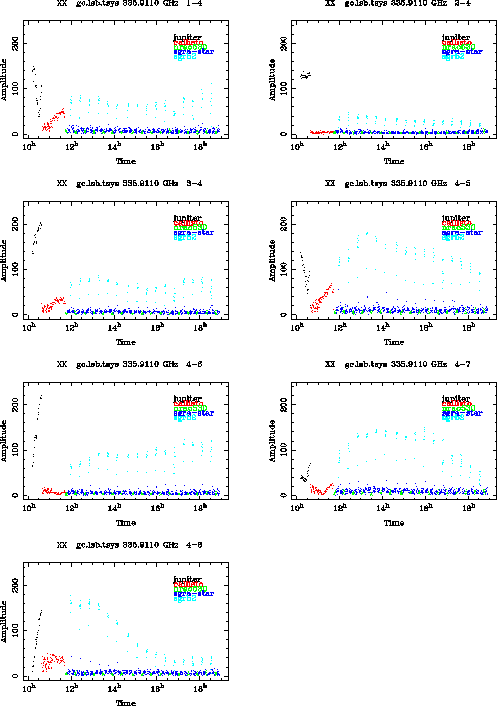
nxy = 2,4
The beginning visibility points in each of scans appear to be bad (Fig.2.8).
Figure:
This plot shows the amplitude of the visibility as a function
of time on the baselines related to antenna 4. The scans on
different sources can be separated by the color. The problematic
visibilities, such as the low gain in the beginning of each
scan, can be easily identified.
 |
Jun-Hui Zhao (miriad for SMA)
2012-07-09