
Images

From Lee et al. (2015), which characterized the well known L1448N protostellar region.
From Lee et al. (2016), which show that wide binaries have randomly or perpendicularly aligned outflows.
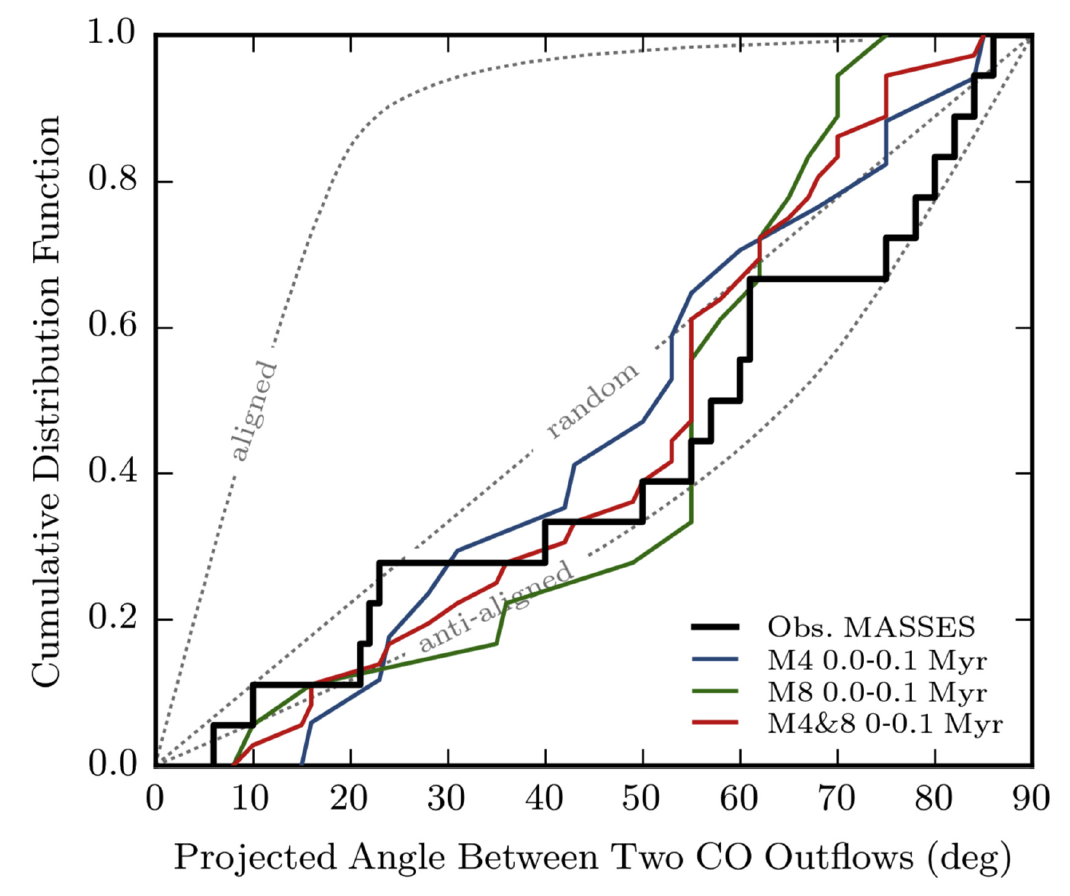
From Offner et al. (2016), which found that the results from Lee et al. (2016) could be explained by turbulent fragmentation.

From Frimann et al. (2017), which showed that C18O envelopes are bigger than expected by the bolometric luminosity, which can be explained by episodic accretion. Contours show the C18O while the color scale shows 1.3 mm continuum emission.

From Stephens et al. (2017), which showed that angular momentum of protostars may be independent of the filamentary structure. Magenta lines show the outflow directions while blue contours shows the location of the dense, clumpy structure.

From Pokhrel et al. (2018), which showed that inefficient thermal Jeans fragmentation works hierarchical: from the cloud to protostellar/disk scale.

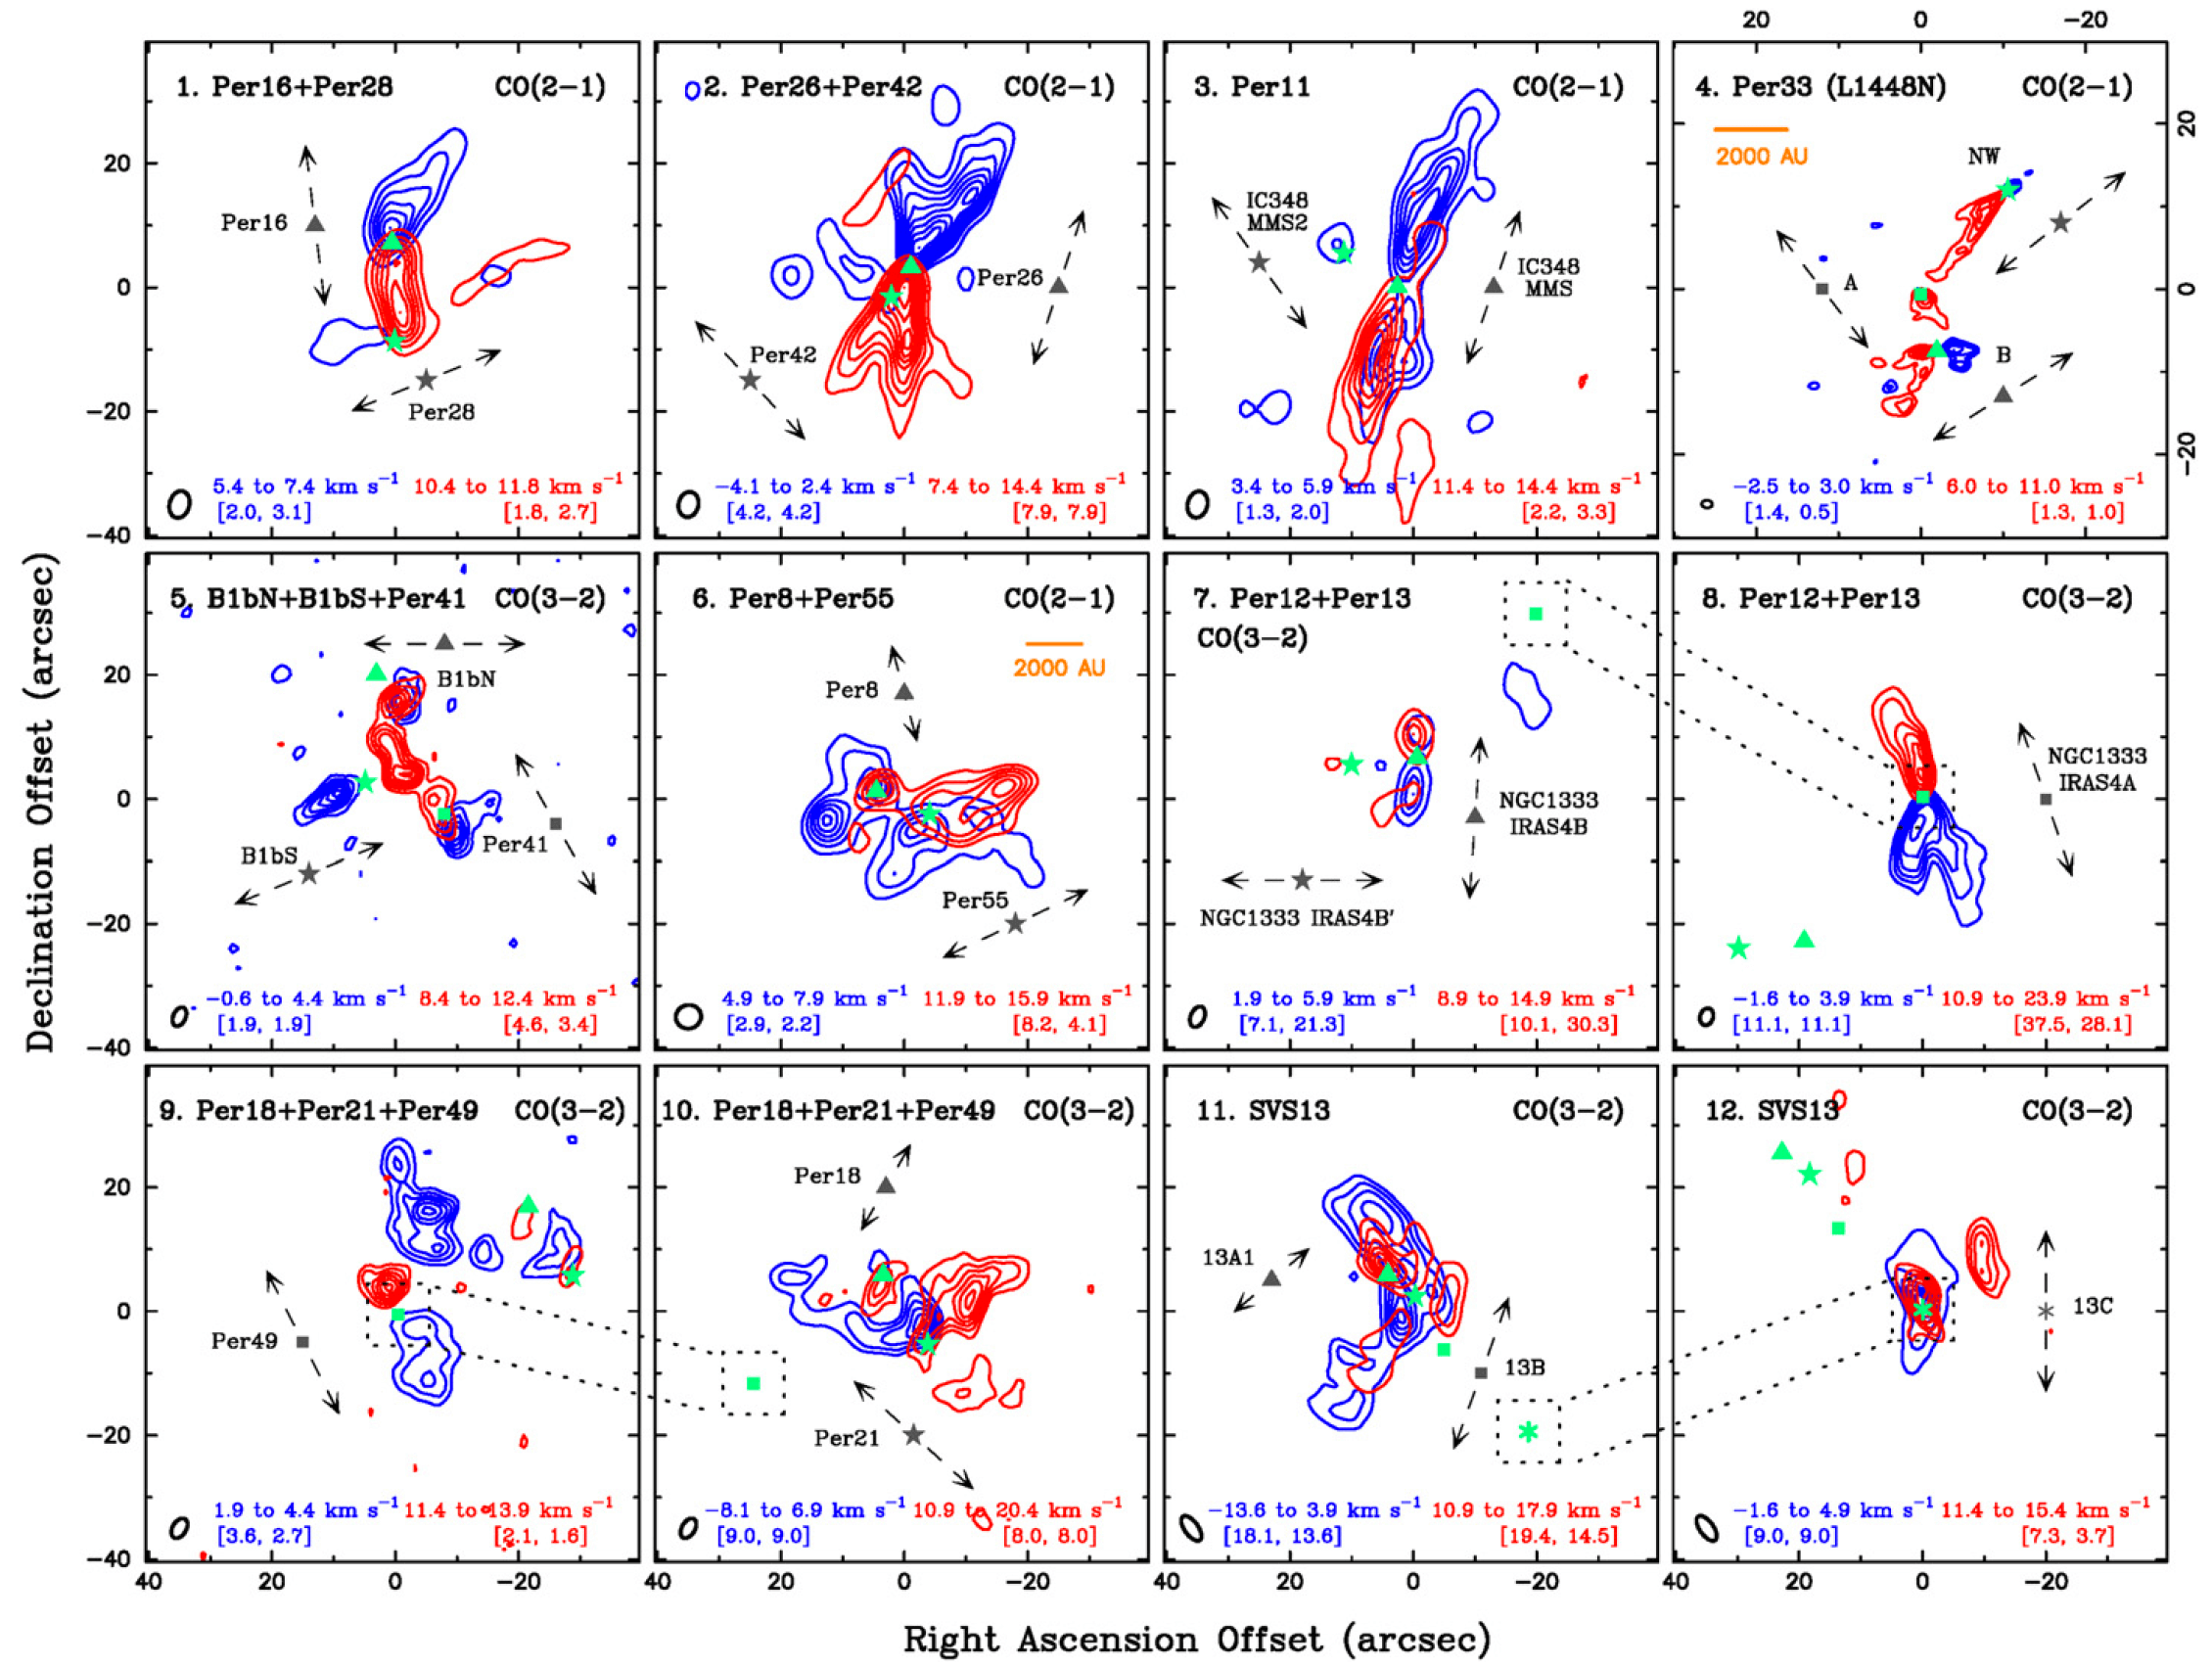
From Stephens et al. (2018), which released all Subcompact 1.3 mm data. This figure shows protostellar outflows (red- and blue-shifted emission shown with red and blue contours) and the continuum (black contours).