The RTDC
Processing SMA Data
1.2 m Telescopes
AST/RO
Extra
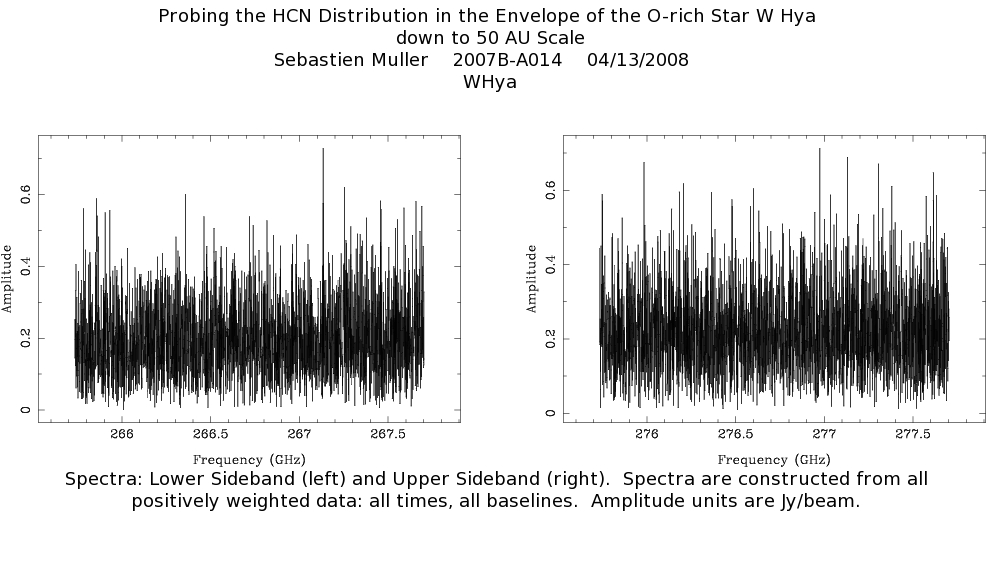
| Sebastien Muller | 2007B-A014 | 04/13/2008 |
|
| Spectra: Lower Sideband (left) and Upper Sideband (right). Spectra are constructed from all positively weighted data: all times, all baselines. Amplitude units are Jy/beam. |
|
|
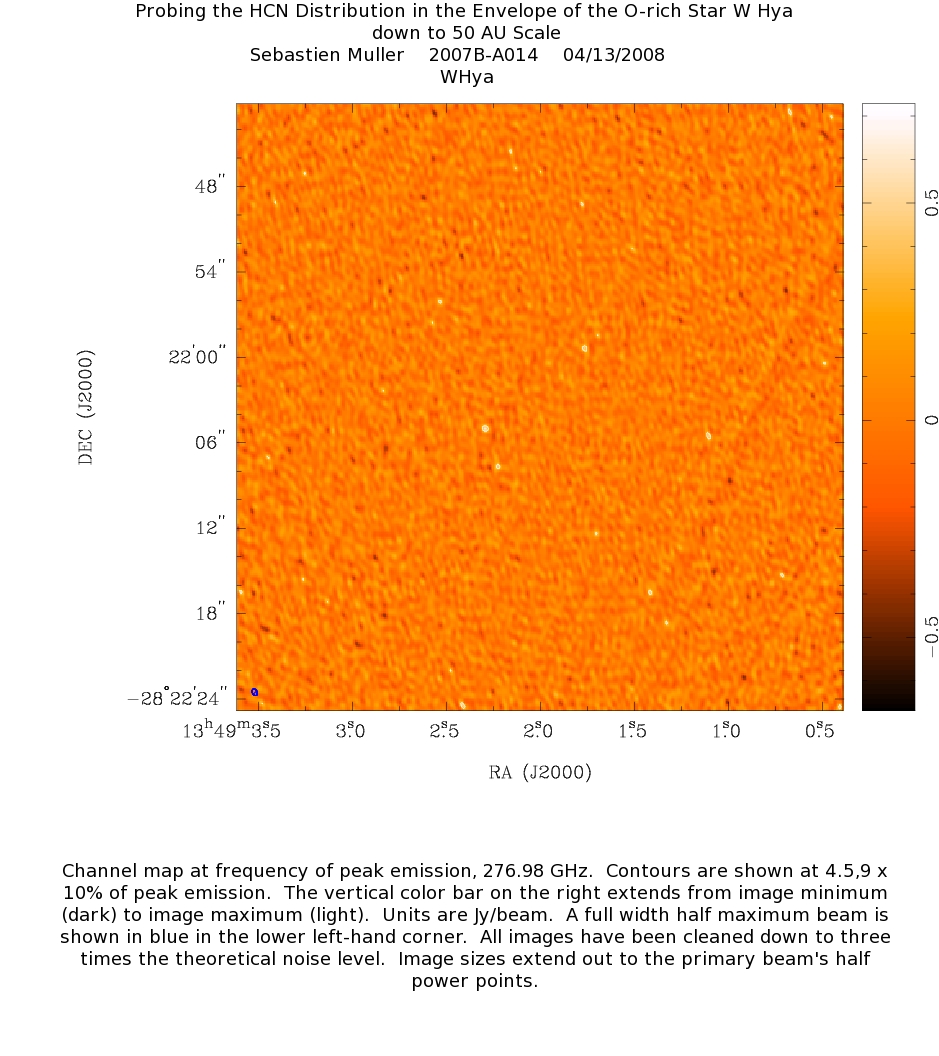
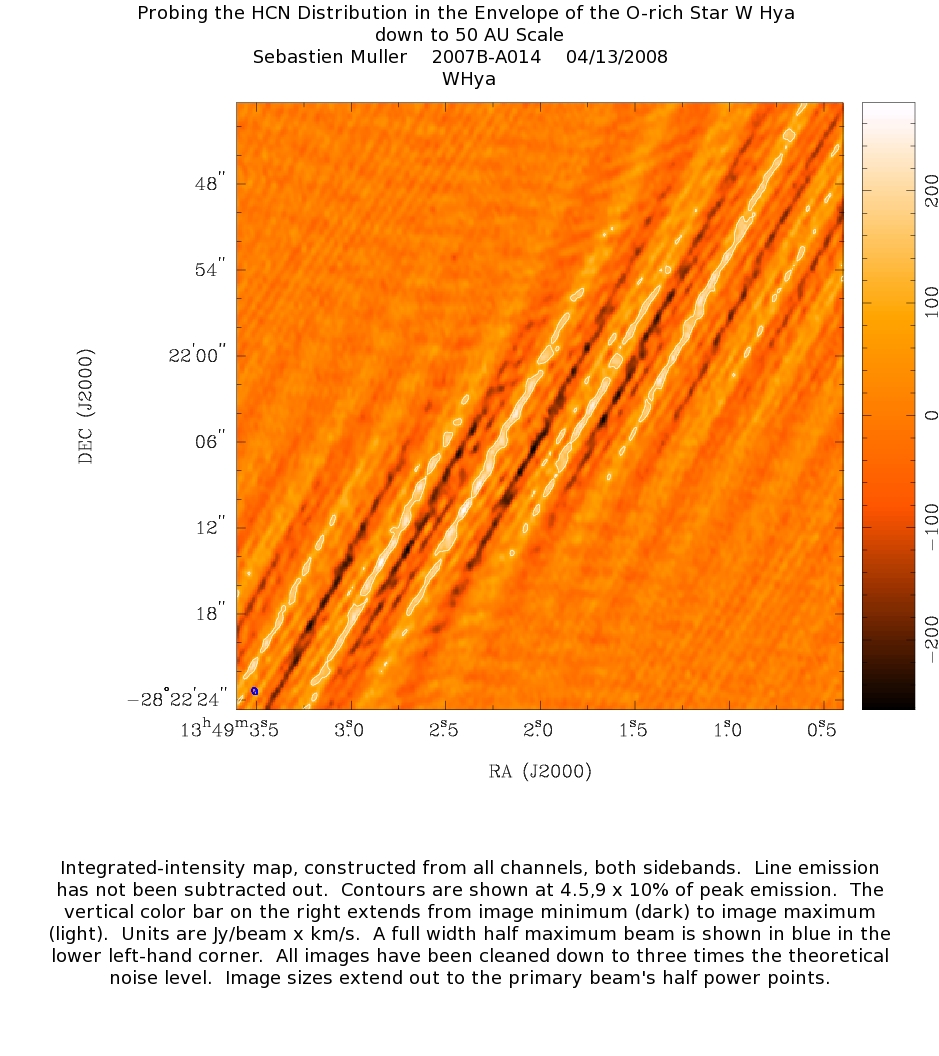
| Channel map (left) at frequency of peak emission, 276.98 GHz. Contours are shown at 4.5,9 x 10% of peak emission. The vertical color bar on the right extends from image minimum (dark) to image maximum (light). Units are Jy/beam. A full width half maximum beam is shown in blue in the lower left-hand corner. All images have been cleaned down to three times the theoretical noise level. Image sizes extend out to the primary beam's half power points.Integrated-intensity map (right), constructed from all channels, both sidebands. Line emission has not been subtracted out. Contours are shown at 4.5,9 x 10% of peak emission. The vertical color bar on the right has units Jy/beam x km/s. |
CENTER FOR ASTROPHYSICS | HARVARD & SMITHSONIAN
60 GARDEN STREET, CAMBRIDGE, MA 02138