-
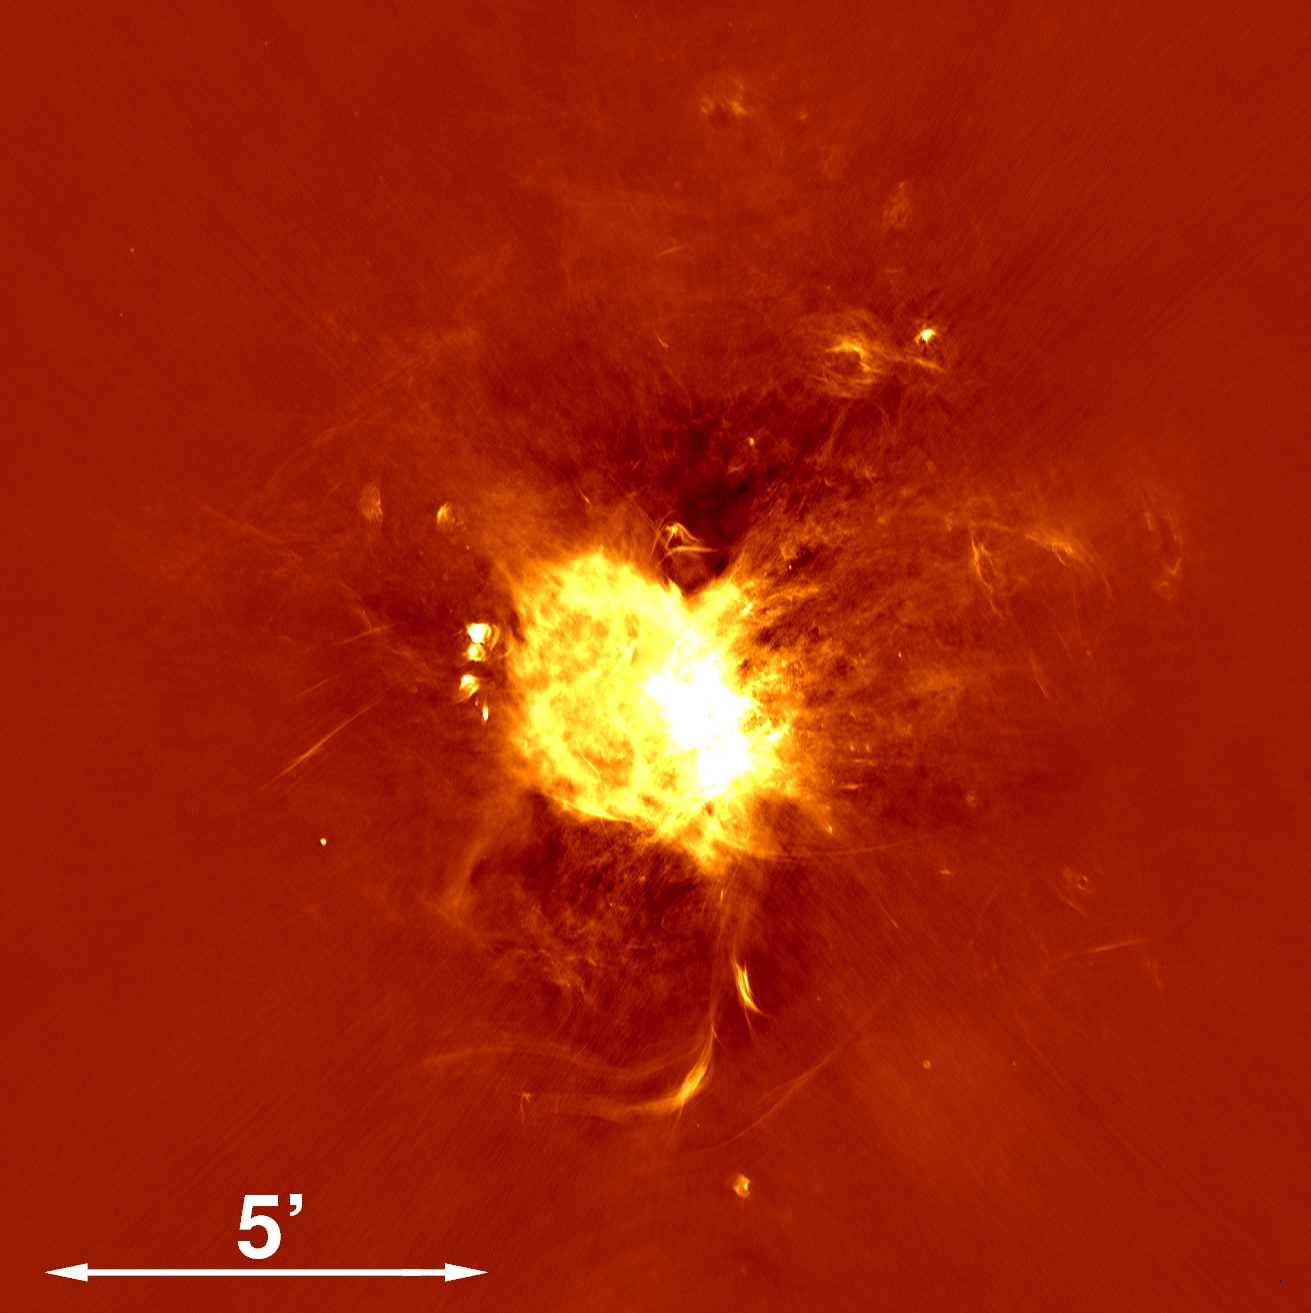
Overall radio structure - the 2012 JVLA C+B-array image
of radio intensity at 5.5 GHz, constructed with uniform
weighting and cleaned with MFS-MS algorithm, showing the
central 15' radio bright zone (RBZ) at the Galactic center.
The rms noise is 8 μJ/beam with a FWHM beam (1.6" x 0.6", PA=11o)
-
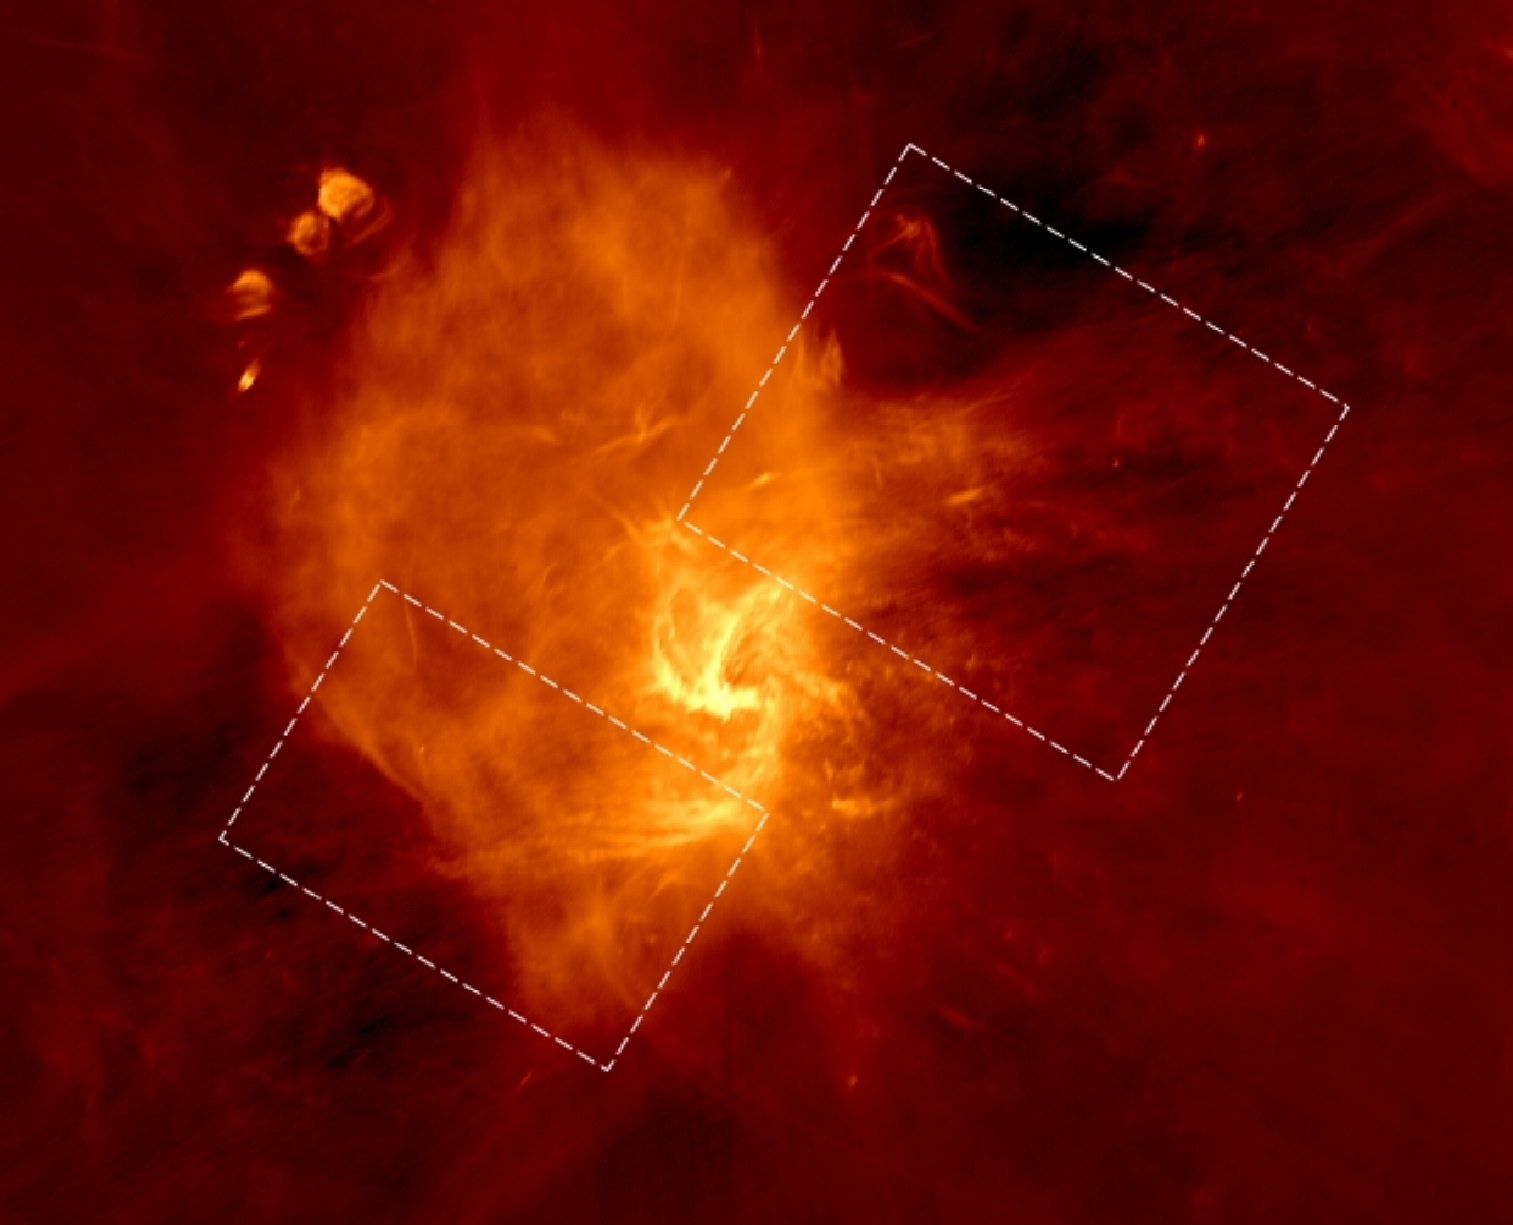
a 5.5 GHz image in Galactic coordinates (increasing
Galactic longitude is up) showing with dashed rectangles
the regions containing the SE (lower-left) and NW (upper-right)
"wings" that extend from the Mini-spiral arms, in the direction
nearly perpendicular to the Galactic plane.
the top image.
-
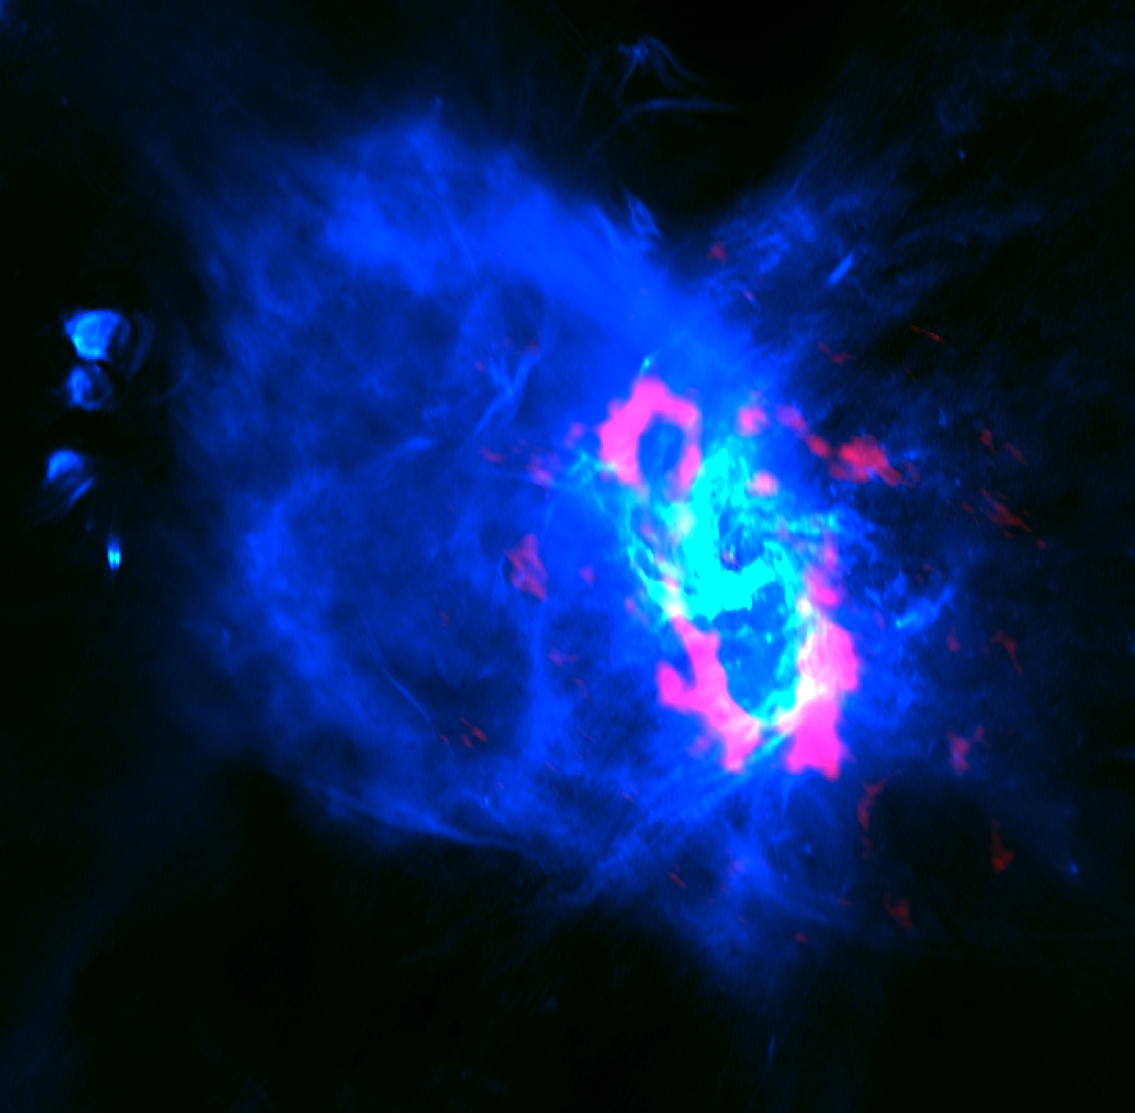
Superposition of the 5.5 GHz JVLA continuum image (blue),
and the CN molecular line image (red) observed with the SMA
(Mart ́ et al. 2012). The combination results in a pink colo
for the CND. Radio continuum emission from the Mini-spiral HII g
as ın appears in light blue.
-
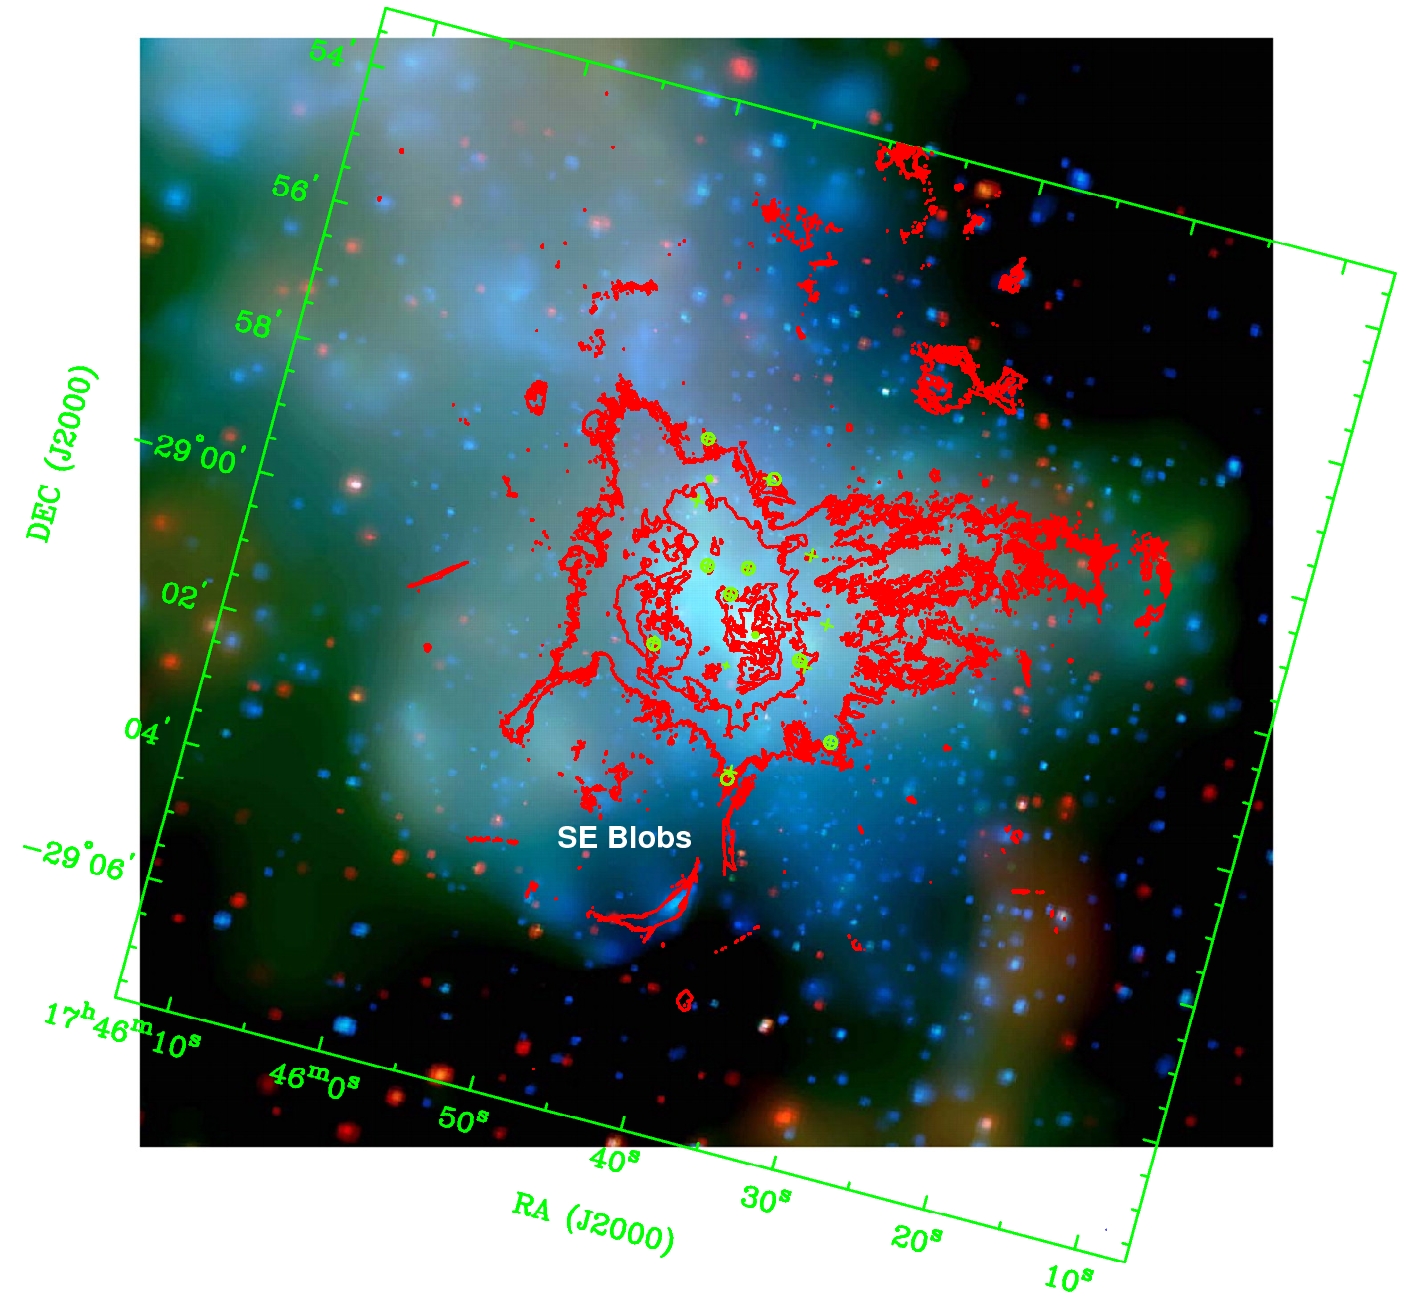
Radio contours (from JVLA) overlaid on the Chandra X-ray
image integrated over 1 Msec (Markoff 2010). Thecoordinate
frames between the X-ray and radio images were aligned using
a dozen X-ray compact sources with positions given by Muno et al.
(2009) include Sgr A* and the Cannonball (Park et al. 2005; Zhao,
Morris & Goss 2013). In this figure, the X-ray and radio lobes are
oriented almost horizontally, or at a position angle of ~ -75o
with respect to equatorial north.
-
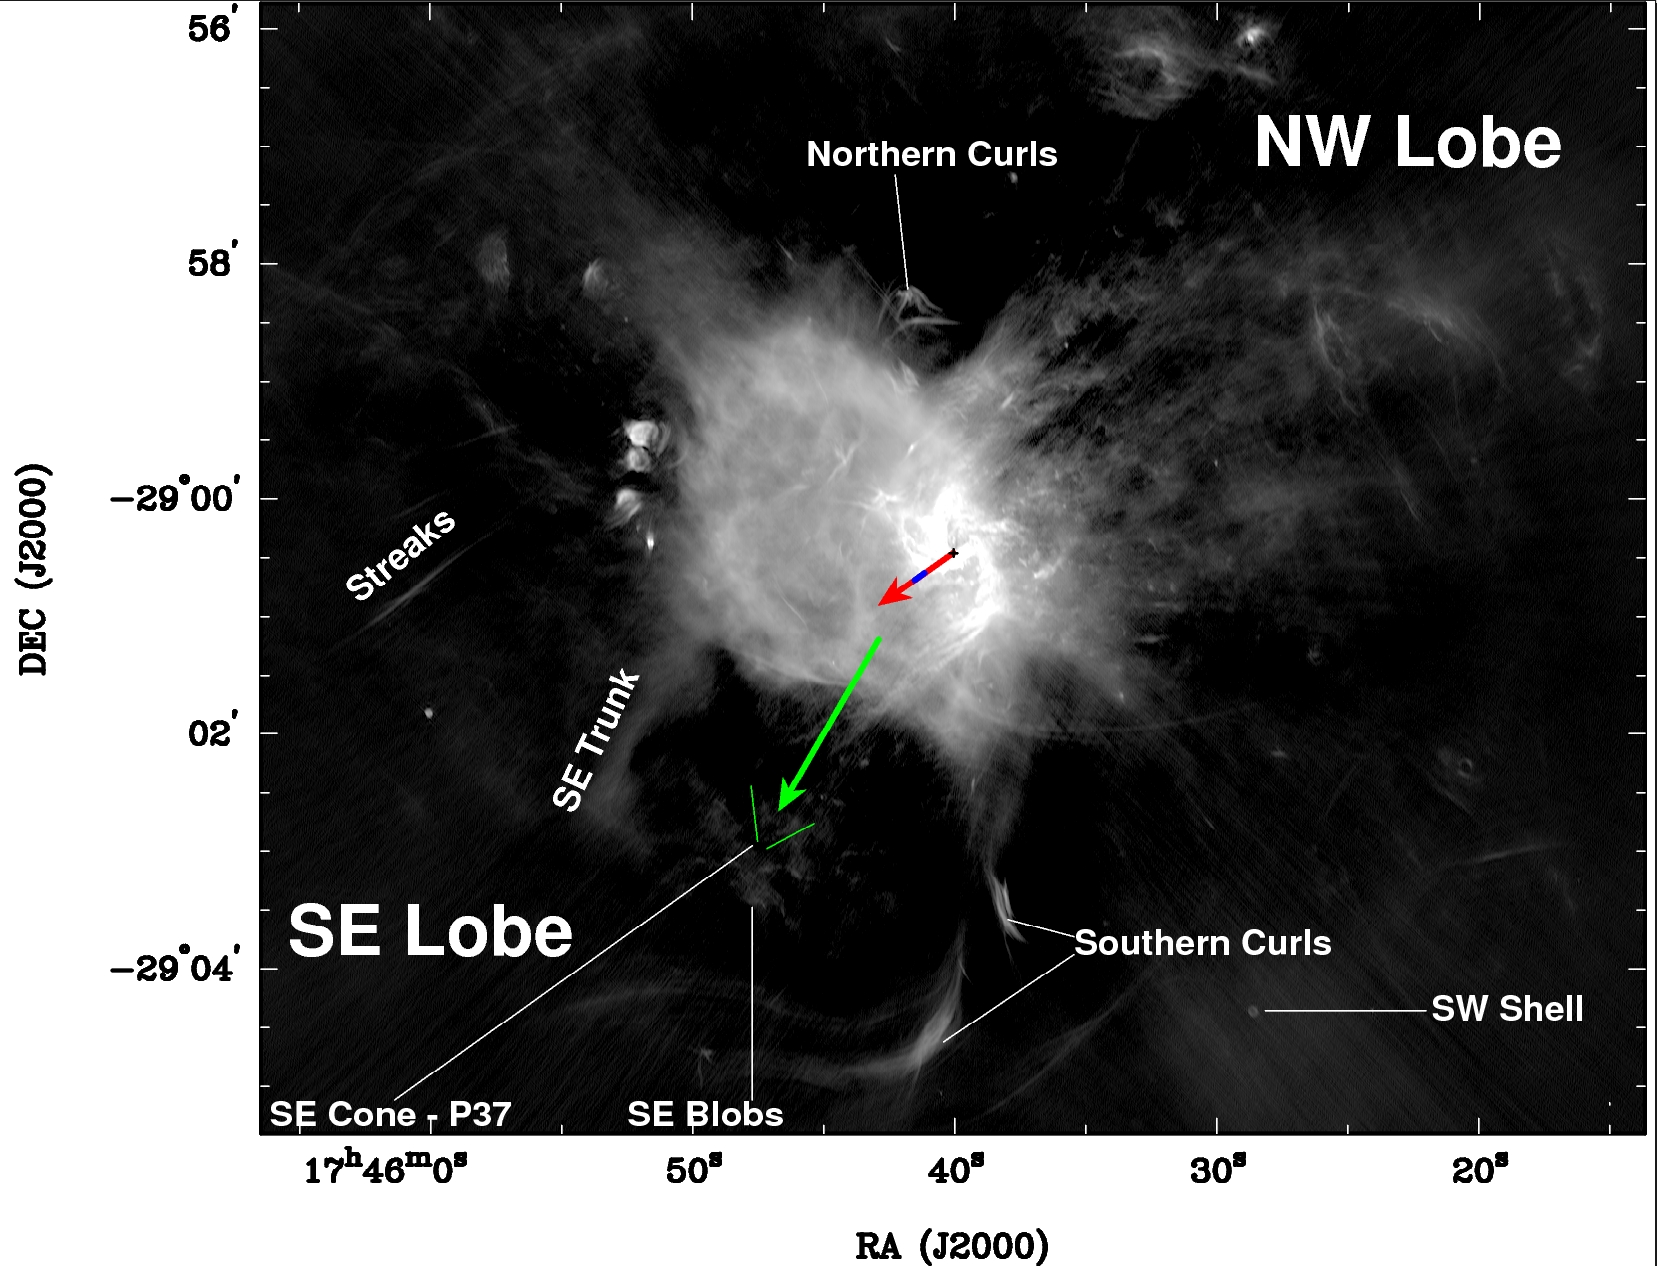
Radio lobes displayed in the JVLA 5.5 GHz image; the red vector
line indicates the direction of an X-ray feature (blue segment)
that has been proposed to be part of a jet from Sgr A* (Li et al. 2013);
the green vector line points to the tip of the "V"-shaped feature,
SEblb-5, in the SE Lobe (c.f., section 3.4.2 and Fig. 8.).

-
The 5.5 GHz radio image showing the emission streamers as labelled
in the NW radio lobe with the FWHM beam of 1.6" x 0.6" (PA=11o).
Also the radio counterpart of the compact X-ray source CXOUGCJ174538.0-285911
is marked with an open arrow. The inset at top left shows the head-tail
structure of the southern arch of source "M", located in the region
marked with open rectangle. The contours of this inset are 1 σ
x
(100, 150, 250, 400, 600, 850), σ = 8μ /y beam, and the beam is marked
on the top-right corner. The bottom-right inset presents the radio image
as contours (at 10μ Jy / beam) x 2n and n = 2, 7, 9, 10, 11, ..., 16) overlaid
on the HST/NICMOS Pα image(color) (Wang et al. 2010). Both radio and Pα image
have been smoothed with a circular Gaussian of FWHM 2". The equatorial
coordinate frame in this inset has been rotated 15o (clockwise).
The directions of the major axes of the radio streamers in the NW Lobe as
well as the predominant axis of the amorphous blobs in the SW Lobe are marked
by open arrows.
-
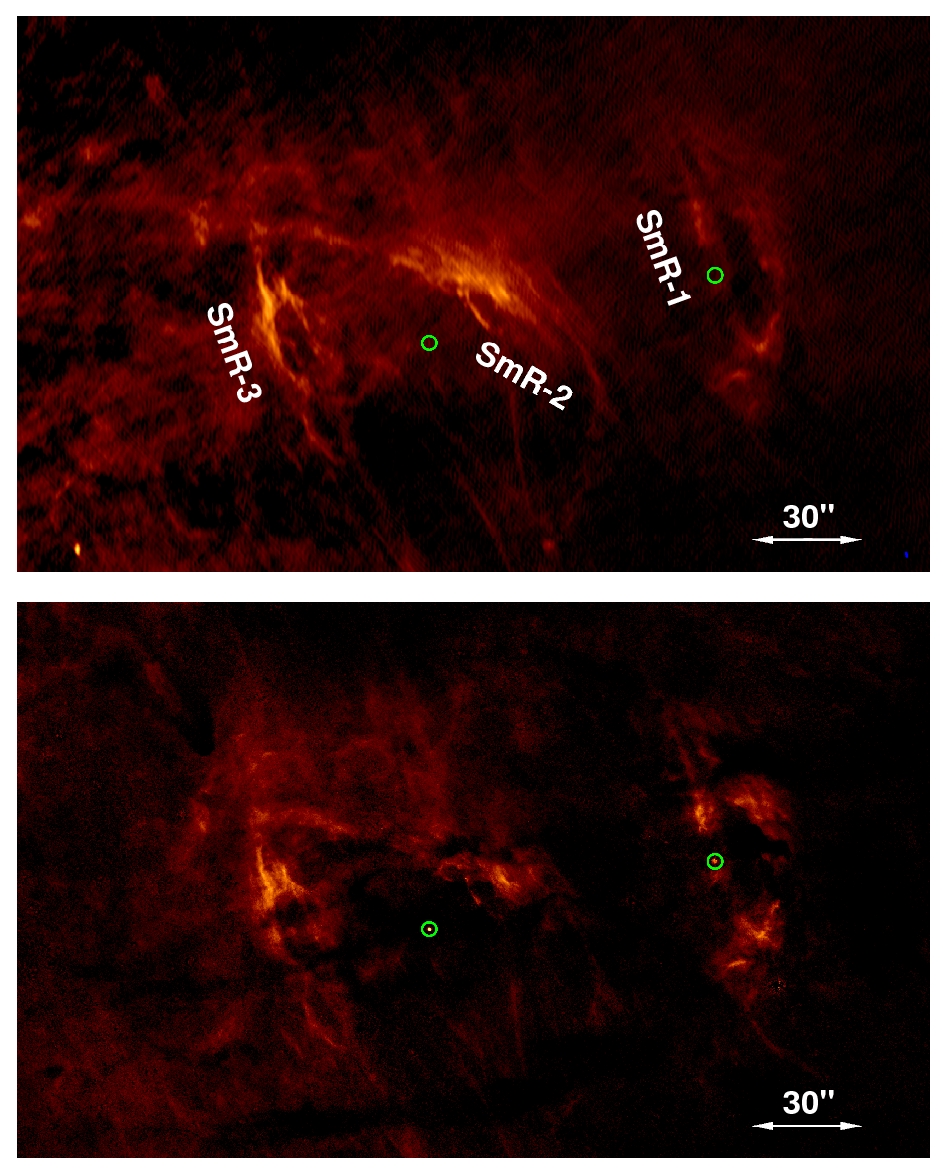
Top: VLA image of 5.5 GHz radio emission from the outermost portions
of the NW Lobe, showing details of the structures that we refer to as
"Smoke Rings" (SmR 1, SmR 2 and SmR 3, from right to left). Equatorial
North is up. The FWHM beam is 1.6" x 0.6" (PA=11o ). No correction
for primary beam attenuation has been applied. Bottom: The HST/NICMOS
image of Pα emission Wang et al. 2010; Dong et al. 2011) corresponding
to the same region. Minor differences between the two images can be
attributed to foreground extinction features that affect the Pα distribution.
The green circles mark two massive stars in the region, as discussed in the text.
-
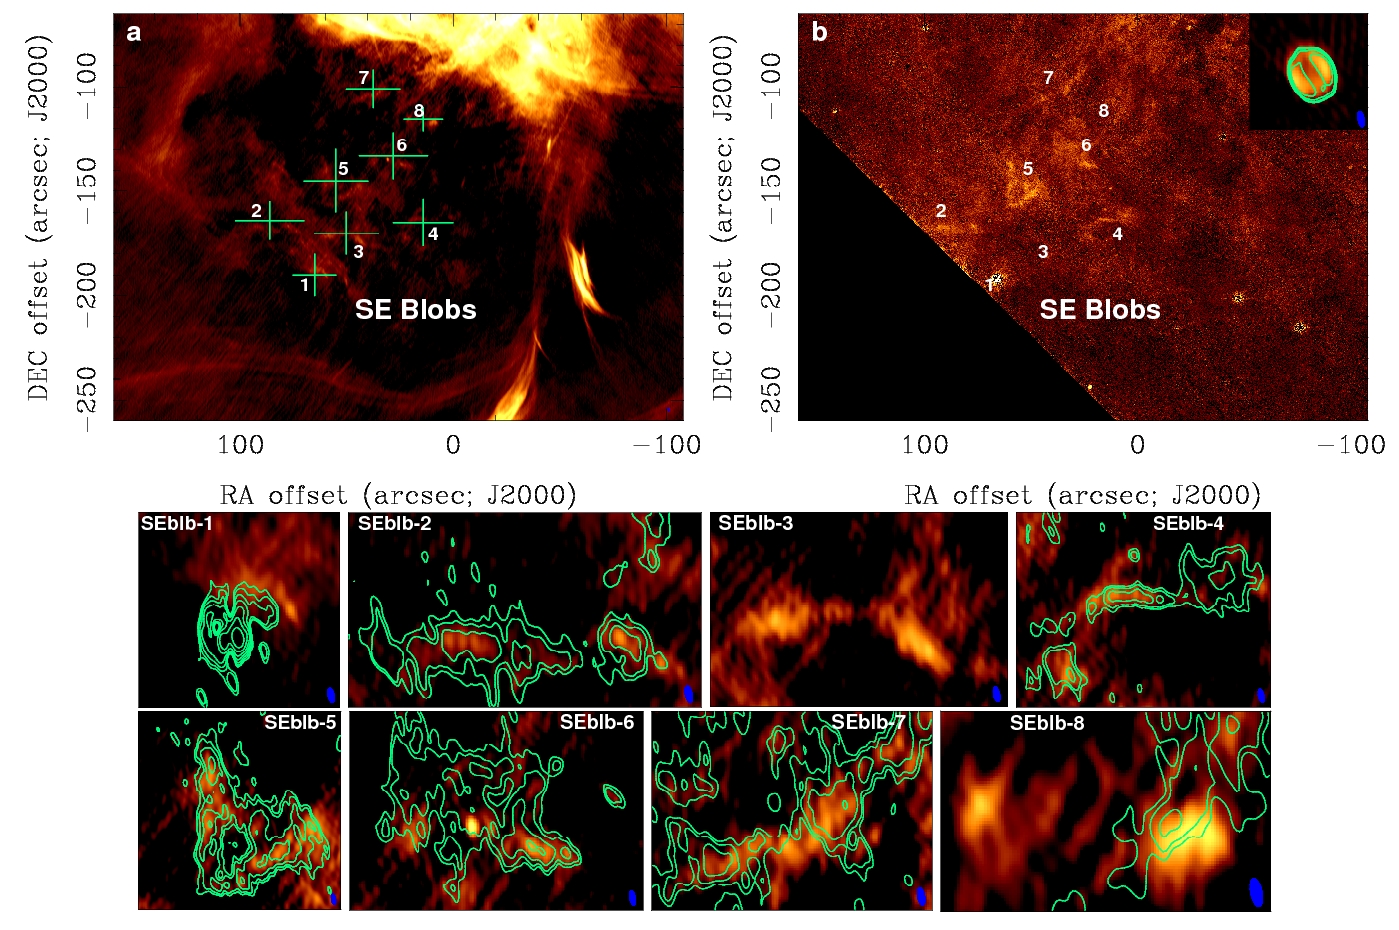
Top panel a: a section of the radio image showing the distribution of amorphous
radio blobs in the SE Lobe. The FWHM beam of 1.6" x 0.6" (PA=11o).
Top panel b: an HST/NICMOS image showing the Pα counterpart of the same region
. The individual components are marked with their sequential numbers in both images. The inset at top-right shows an image of the SW Shell (marked in Fig. 5) in radio (color) and Pα contours) to verify the alignment between the radio and IR coordinate frames. The bottom eight panels show the details of individual components of the amorphous radio blobs (color) overlaid with contours of Pα emission that has bee smoothed with a 2-D Gaussian function identical to the radio clean beam of 1.6" x 0.6" (PA=11o). The central positions (offsets in arcseconds from the field center, see footnote of Table 1) of the eight regions are (65,-190), (86,-164), (50,-170), (14,-165), (55,-145), (28,-133), (37.5,-101) and (14,-115.5).