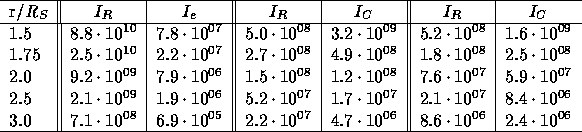
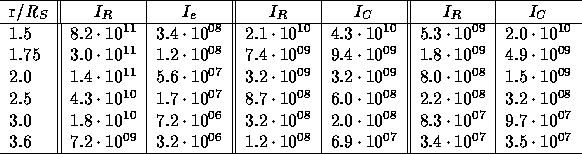
The line intensities (in  ) calculated for the
coronal hole adopting Esser et al. (1986) model are reported in Tables 3
and 4. It is assumed that the coronal hole is spherically symmetric around
its center axis, and that the size of the hole is so large, that the
contribution from the surrounding quiet region is negligible (e.g., Esser
and Withbroe 1989). Subscripts R, C, and e stand for resonantly
scattered, collisionally excited, and electron scattered respectively.
) calculated for the
coronal hole adopting Esser et al. (1986) model are reported in Tables 3
and 4. It is assumed that the coronal hole is spherically symmetric around
its center axis, and that the size of the hole is so large, that the
contribution from the surrounding quiet region is negligible (e.g., Esser
and Withbroe 1989). Subscripts R, C, and e stand for resonantly
scattered, collisionally excited, and electron scattered respectively.
TABLE 3. Coronal Hole (all parameters as in Figure 3.1)
Lyman-O VI
TABLE 4. Coronal Hole (n and T as in Figure 3.1, u = const for
.)
Lyman-O VI
Note that both Table 3 and 4 were calculated with the assumption that
the O VI ions have the same flow speed as the protons. This is
presumably not the case at distances  (e.g., Bürgi and
Geiss 1986; Esser and Leer 1990).
(e.g., Bürgi and
Geiss 1986; Esser and Leer 1990).
The corresponding intensities calculated for the quiet corona are reported in Table 5.
TABLE 5. Quiet Region (parameters from Figure 3.2)
Lyman-O VI
Figure 3.5 reports the total intensities of the two Oxygen lines simulated by
Spadaro and Ventura (1993) for the equatorial coronal hole and the polar
coronal hole. The line intensities range from  to
to
 in the interval of heliocentric
distance 1.2
in the interval of heliocentric
distance 1.2  -- 8
-- 8  .
.
Concluding this chapter, we would like to stress again that the calculated
intensities reported here are meant as order--of--magnitude estimates.
Several parameters entering the calculations have never been measured
before, e.g., the electron temperature at distances above 1.5  ,
the Alfvén wave velocity amplitude (if Alfvén waves play a role at
all), the magnetic field at the coronal base.
,
the Alfvén wave velocity amplitude (if Alfvén waves play a role at
all), the magnetic field at the coronal base.