| The Solar Spectrum | ||
|
The image below shows the solar spectrum at 392 nm (blue) to 692 nm (red) as observed with the Fourier Transform Spectrograph at Kitt Peak National Observatory in 1981. R. Kurucz corrected the spectrum for absorption from the Earth's atmosphere and made an atlas for public use. The data are shown as if acquired by an echelle spectrograph, with wavelength increasing from top to bottom and, within each horizontal row, from left to right. To see an expanded view, click on the image. Spectra of the Sun and other stars tell us the composition, density, and temperature of the stellar atmosphere. Atoms in the atmosphere absorb light emitted at lower layers and produce the dark vertical lines or bands in the spectrum. The amount of light removed and the width of the band are related to the composition, density, and temperature in the atmosphere. In addition to providing measurements of the conditions in the stellar atmosphere, spectra measure the motions of stars. Rapid changes in the dark lines and bands on time scales of minutes are related to motions in the stellar atmosphere. The Doppler shift (the difference between the observed wavelength of the line and its actual wavelength) tells us the velocity of the star relative to the Earth. By measuring changes in the relative velocity with time, we can detect the motions induced by exoplanets or other objects orbiting the star. 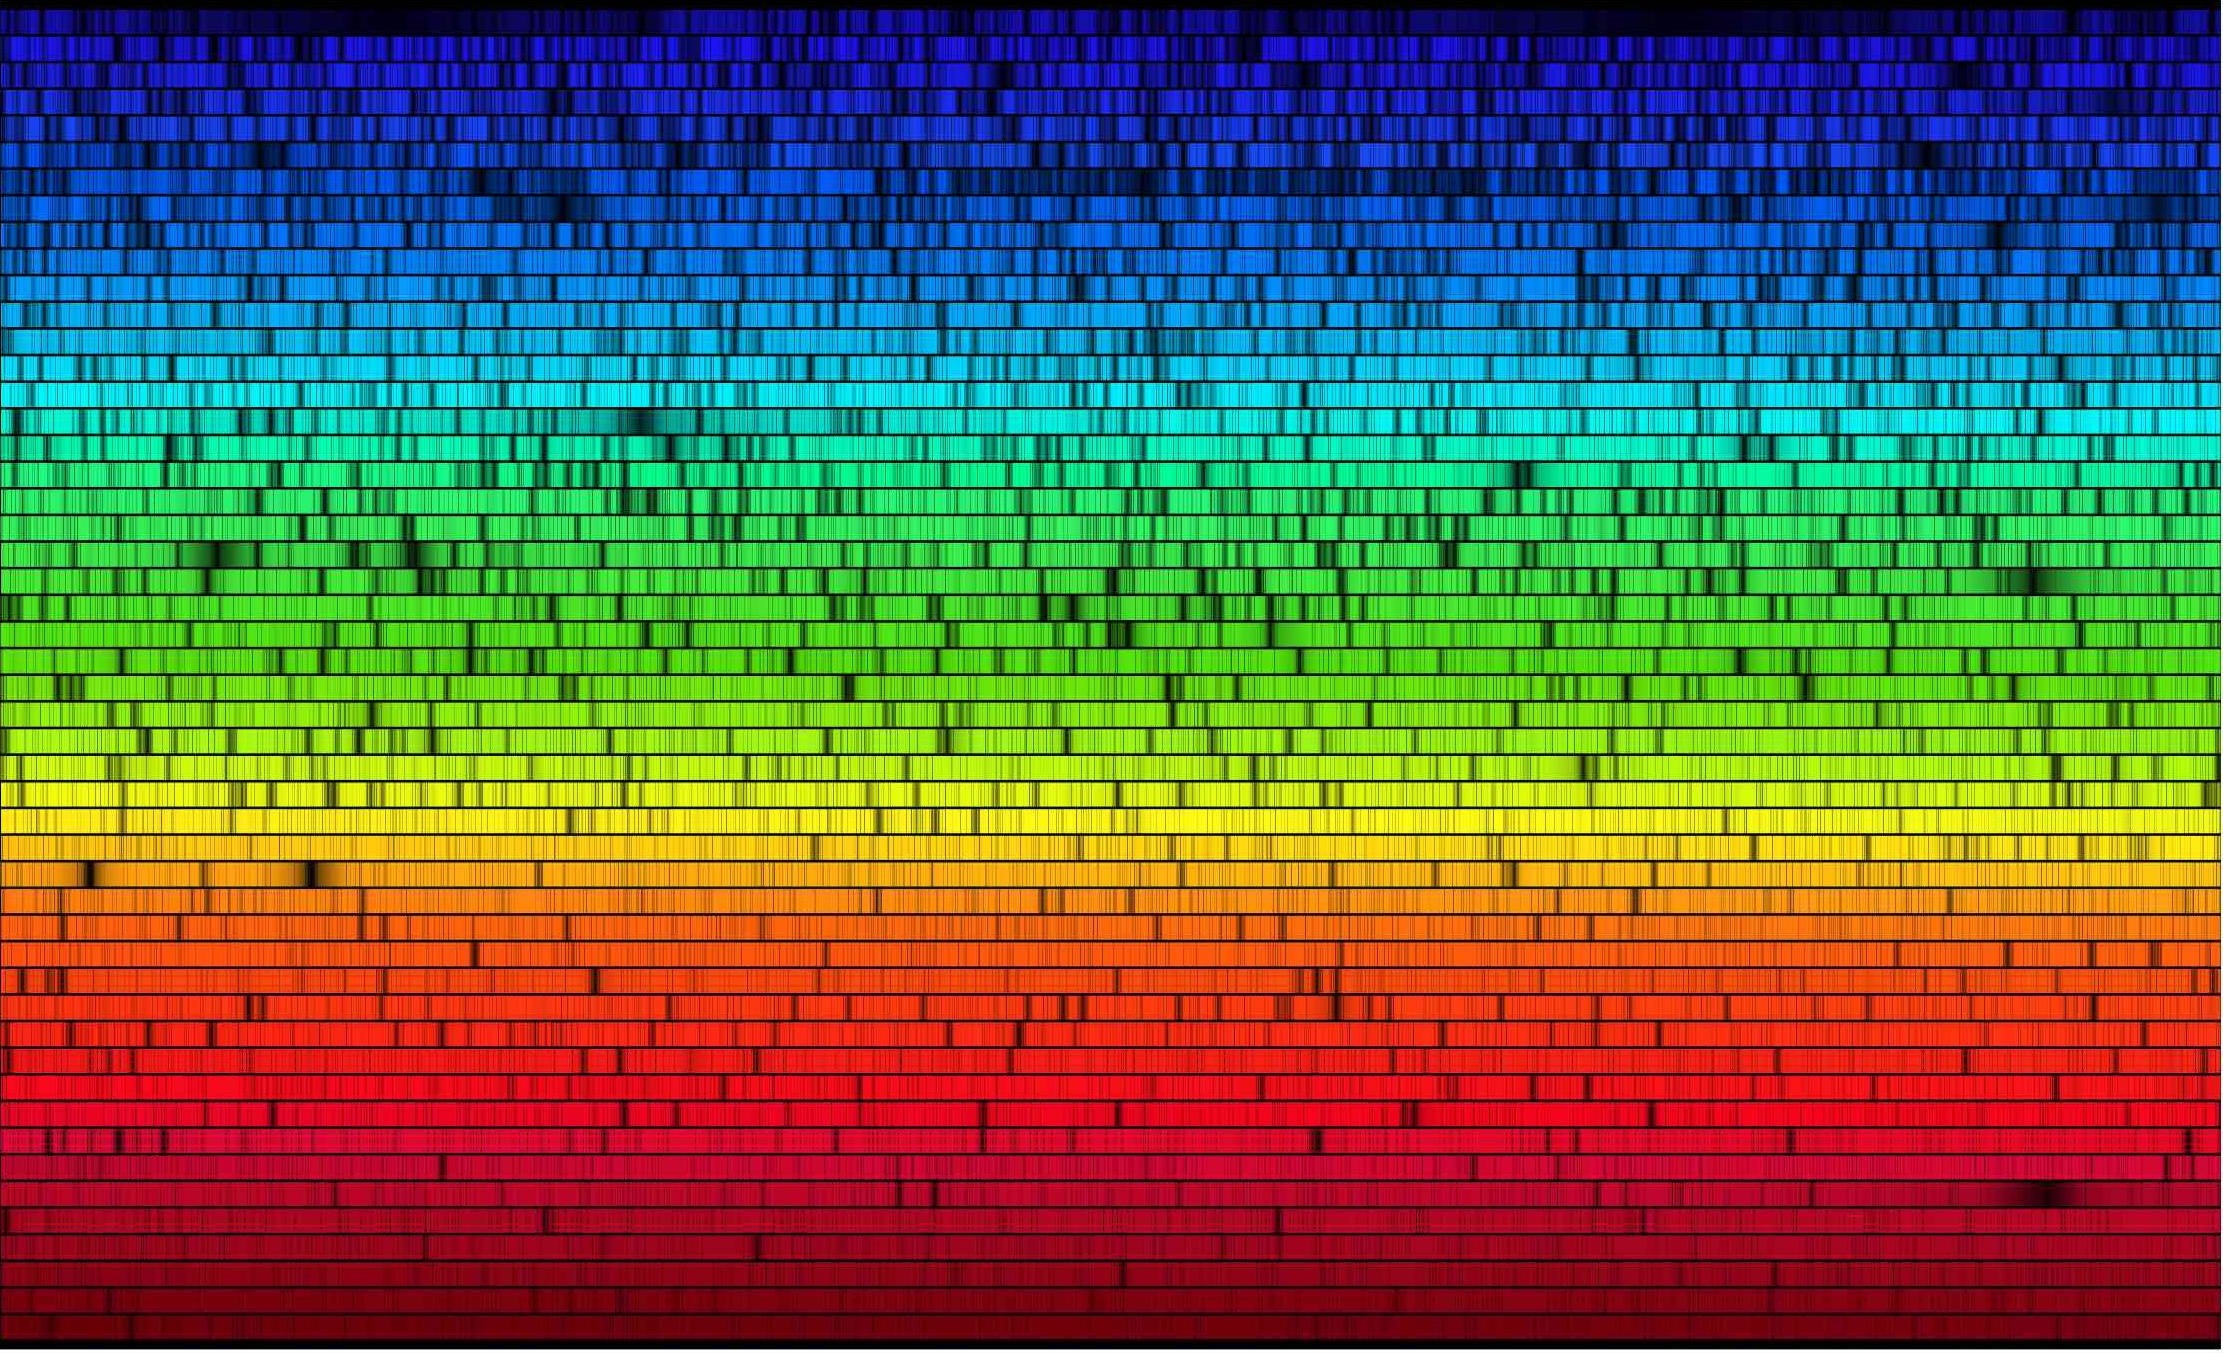
| ||