


Constraining hydrological and cryospheric mass flux in southeastern
Alaska using space-based gravity measurements
Full citation:
Tamisiea, M. E., E. W. Leuliette, J. L. Davis, and J. X. Mitrovica (2005), Constraining hydrological and cryospheric mass flux in southeastern Alaska using space-based gravity measurements, Geophysical Research Letters, 32, L20501, doi:10.1029/2005GL023961
Abstract
Watersheds draining into the Gulf of Alaska (GoA) experience large seasonal and inter-annual variations of water in the form of rain, snow, and ice, but accurate constraints on these variations have been difficult to obtain. Over larger geographic regions, water variations can be inferred directly from the Gravity Recovery and Climate Experiment (GRACE) data. However, because GoA variations occur over such a small region, the inferred average value of water flux increases as the applied smoothing of the GRACE data decreases. We use this observed scaling together with scaling results obtained from forward models to infer a seasonal amplitude of 115 ± 20 km3 of water and an average contribution to sea level rise over the two years of data of 0.31 ± 0.09 mm/yr. These results suggest that accelerated melting that began in the late 1990s, as inferred from altimetry, continues unabated.
Figures
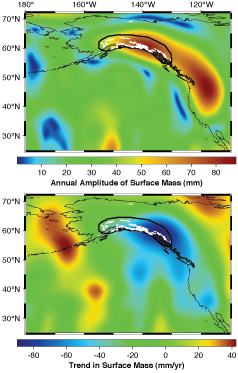
Figure 1. Annual amplitude and trend of surface mass estimated from GRACE data. A Gaussian filter with a radius of 500 km is applied to the data. Regional averages are calculated over the area inside the region surrounded by a thick black line. Glaciated regions (Alaska Department of Natural Resources, Glaciers, 1 to 2,000,000, www.asgdc.state.ak.us) are displayed in white.
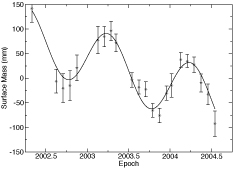
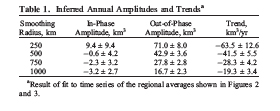
Figure 2. Regional average over area shown in Figure 1 using a 500-km-radius Gaussian filter. Solid line indicates least-squares fit to annual cosine and sine, rate, and constant. (The constant is removed from both the data and the fit in this plot.) The error bars are 1-σ estimates of the uncertainties present in inferences based upon satellite errors (equation 1). The inferred parameter values (converted to an equivalent volume of water) are shown in Table 1.
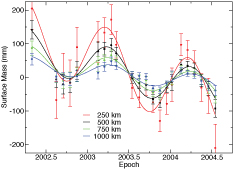
Figure 3. Regional averages (as in Figure 2) using different radii for the Gaussian filtering. The amplitude increases as the smoothing radius decreases, as would be expected for a large mass change occurring over a small geographic region.
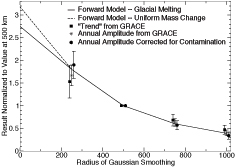
Figure 4. Ratio of results with respect to the value obtained for a 500-km-radius Gaussian filter. The results at 0 km represent the full forward model results assuming data to degree and order 512. The values at each radius are slightly offset horizontally for clarity. The forward model assuming a uniform mass change model would be more appropriate for the annual variation.
Acknowledgements:
We would like to thank an anonymous referee for comments. This work was supported by NSF grant EAR- 0125518, and NASA grants NNG04GL69G and NNG04GF09G.
For questions or comments on web site contact: Geodesy Webmaster
Document URL: lweb.cfa.harvard.edu/space_geodesy/SCIENCE/2005/ConstrainingHydrologicalAndCryosphericMassFlux/index.html
Last Modified: Monday, 22-Jan-2007 14:51:55 EST