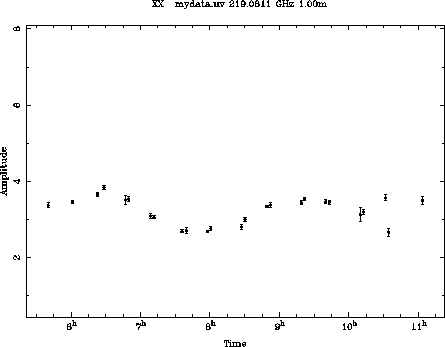
  Task:   smauvamp
  vis      = mydata.uv                     % uv file name
  select   = source(sour1),uvrange(25,100) % select sour1 and
                                             uvrange from 25 to 100
                                             kilo wavelengths
  axis     = time,amp                      % time for x-axis
                                             amplitude for y-axis
  average  = 1                             % averaging the visibility
                                             in time interval of 1 min
                                             for each baseline prior to
                                             doing bin statistics
  nbin     = 50                            % make 50 bins in the
                                             range of x-axis.
  device   = /xs                           % plotting device