smablflag% inp
 Task:   smablflag
  vis      = gc_rx1.lsb.tsys
  line     =
  device   = /xs
  stokes   = xx
  select   =
  axis     = time,ampl
  options  =
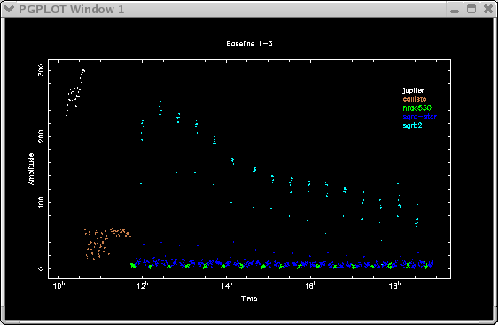 |
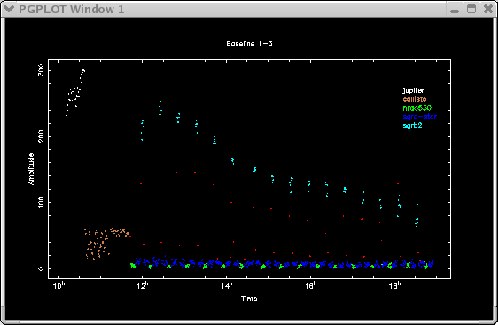
The defaults in line and select lead to average all channels in all the spectral windows and plot the visibilities (time vs. amplitude) on each baseline. Fig.2.9. shows a visibility plot (time vs. amplitude) on baseline 1-3 for the five sources observed in the program. The bad correlations in the beginning integration during repointing the array from one source to another are obvious. For example, the relatively higher amplitude in SgrA* and relatively lower amplitude in SgrB2 are clearly bad correlations. Users can flag bad data by moving the plotting cursor to the problematic visibility points and clicking the ''left button'' of the computer mouse. After marking all the bad visibilities (the red points) on one baseline (see the bottom panel of Fig.2.9), users can move to the next baseline by clicking the ''right button'' of the mouse. Users can go through all the baselines to flag bad correlations. The task smablflag only changes the flag status for the bad correlations (red points; see Fig.2.10) and no data points have been removed from the uv file in the flagging process. Any mistakes in the flagging process can be corrected and flagged data can be recovered.