SMA Technical Memorandum #110
To: Marty Levine
From: Ken McCracken
Date: July 1, 1997
Subject: Thermal Resistance Testing of the Haystack VLSI Correlator Chip
Re: P.O. SA738042
The thermal resistances of the Haystack VLSI Correlator Chip were measured in wind tunnel testing. The tests were performed by Analysis Tech of Wakefield, MA. Detailed tests were performed on three chip samples at varying chip power dissipation levels and wind speeds. The purpose of this testing is to use the results for the thermal design of the digital correlator (obtain accurate junction temperature predictions for reliability estimations).
In order to apply what is learned from these measurements to the SMA application, certain terms must be defined. The concept of thermal resistance is one of those terms which is used frequently for component thermal characterization. The thermal resistances which will be discussed here are thermal resistance junction to ambient, thermal resistance junction to case top, and thermal resistance junction to case bottom. They will be abbreviated to Rj/a, Rj/ct, and Rj/cb respectively. Each thermal resistance assumes the heat leaving a component travels from one isothermal surface (ie. The junction) to another isothermal surface (ie. Case top). In reality, these surfaces are very rarely isothermal. However, they are often convenient locations to instrument with a thermocouple. By equation this concept is expressed:
R j / r = ( Tj - Tr) / P diss
where R j/r = thermal resistance junction to reference point
Tj = Junction Temperature
Tr = Reference Point Temperature
Pdiss = Power Dissipated
This parameter is very dependant on the specific set of environmental conditions under which it was calculated. For instance, if a component has one side of it’s case screwed to a heatsink the Rj/c will be quite different then if the same component’s case is convecting to free air. Also, the power level at which the thermal resistance is determined can affect the predominant methods of heat transfer from the component. Non-linear effects may become significant at high power levels further complicating the use of the thermal resistance value. For these reasons, the thermal resistance value must accompany the description of the test conditions to which it applies.
Since a thermocouple can be applied to the outside case of a component package or immersed in a fluid the only difficult temperature to determine for a thermal resistance calculation is the junction temperature. The test method employed to measure the junction temperature is called the electrical junction temperature measurement. It uses the fact that the voltage drop across a semiconductor diode junction is temperature dependant. Knowing this relationship, the junction temperature of a device can be measured without requiring physical access to the actual die.
A constant forward-biased current is applied to a diode on the die and the resulting forward-biased voltage drop measured as a function of temperature. The applied current should be small enough to prevent self-heating of the device yet large enough to establish conduction through the body of the junction. This procedure is done with the device in a stirred bath of mineral oil. The temperature of the oil is raised to a maximum temperature and the entire bath is allowed to slowly cool. Measurements of Vf and the bath temperature are to be taken while the chip is unpowered. This assures an isothermal chip condition while the voltage drop is measured. This device calibrating relationship is described by the following equation:
Where Tjunction = Junction Temperature
m = slope (deg/volt)
Vf = forward voltage drop
To = y axis intercept
Identical parts are not calibrated in the bath, but, are adjusted for variations by using one temperature-voltage measurement. This point is usually the ambient temperature and since identical parts will have the same slope, m, only the recalibrated To, or y axis intercept needs to be calculated.
The test parameters for this set of testing involves varying power dissipation, air velocity, and measuring the relative cooling through the board to the backside of the PCB. To ensure a proper sampling of correlator chips, six chips were sent to Analysis Tech. Only three chips were required to be calibrated and certain tests were to be performed on all three samples to eliminate the risk of using data from a deviant chip.
Since the actual operating power dissipation is not known now, it was decided to test over a potential range of dissipations. The power dissipation levels used for the testing come from a list of possible power dissipations supplied by Will Aldrich of MIT/Haystack. His email describing these power levels is listed in Appendix A.
A range of air velocities has been chosen based on the relative area available for air flow through the correlator crate and the 900 acfm available to each digital correlator rack (per SMA Spec 40165010000). However, since the receiver and daughter board mechanical configuration is still undefined the range was expanded. Also, since the testing will be done at sea level and the actual application is at 14,000 feet altitude, the test air velocities were shifted down by the ratio of the air densities. Of further interest from this testing is to determine if the design is approaching the range where increasing the airflow has little affect on cooling the junction further. This would be shown as the Rj/a staying at the same level for increasing airflows.
A final test parameter is to test a potential improvement to the chip cooling scenario. This would involve using a thermally conductive spacer to bridge the gap between the component’s bottom case and the PCB. This may help cool the chip better than a top-sided heatsink on this cavity-up PGA and eliminate the maintainability problem associated with the heatsinks. Tests will be run to measure the relative amount of cooling that is provided off the backside (non-component side) of the PCB. Foam insulation will be applied to the pin side of the test board to prevent heat transfer and the thermal resistance results compared to the non-insulated backside case.
The initial testing involves calibrating the components in the mineral oil bath. An Analysis Tech Device Calibration Bath was used to calibrate two chips. A single point calibration was performed for the remaining four chips.
All the test measurements of thermal resistance were taken in Analysis Tech’s wind tunnel. It is equipped with a connector to power up the test chip board, a thermocouple to measure air temperature, and a hot-wire anemometer to measure air velocity. The fan and fan motor are under closed-loop control by the air speed which is either manually or computer selected. Additional thermocouples are attached to the component’s case, both top and bottom, and their wires run under the access cover to the Thermal Analyzer. These two thermocouples provide the reported Rj/ct and Rj/cb values.
Analysis Tech’s Thermal Analyzer is programmed to supply the chip under test with the appropriate voltage and current to simulate operational dissipation (using an appropriate power supply). The junction temperature can not be sensed while the die is powered up so the heating power is on for 15 seconds and then turned off for 200 µsec. During this 200 µsec the sense current is applied across the calibrated diode and the voltage drop measured. This period of unpowered time is so small that the die has very little time to cool off. The analyzer calculates an instantaneous Rj/a and an average Rj/a which is a moving average of the last eight Rj/a values. Once the instantaneous and average Rj/a are within 0.5% of each other equilibrium is said to be achieved (additional time restrictions are also imposed). The program then moves the test setup to the next preprogrammed test condition.
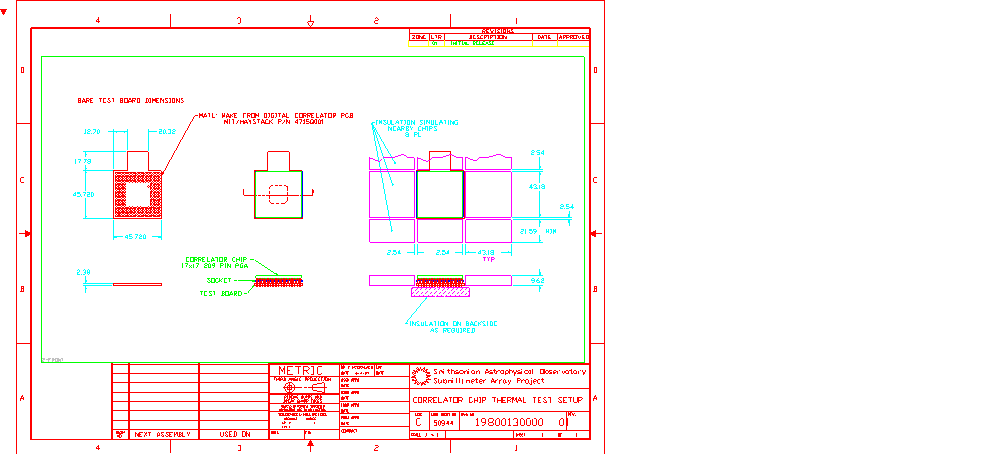
To further simulate the actual conditions a scrap digital correlator PCB was supplied from Haystack. The PCB was cut to the size of one correlator chip with a small tab left for mounting. The actual socket used was soldered in and the chip mounted as it would be in actual service. The tab was screwed into the Analysis Tech’s test adapter board which fits into the wind tunnel’s connector. To simulate the chip under test as being in the middle of a PCB, a foam air block was made. Using the actual correlator board and socket eliminates guessing how closely the test setup matches the “through the board” thermal conductivity. The correlator test board and foam air dam are detailed in SMA drawing number 19800130000 (included in Appendix B). All thermal resistance measurements were taken with the foam air dam mounted on the test board.
Appendix C lists the calibration results for one of the calibrated chips (either Sample #99 or #84). From John Morley of Analysis Tech the two chips were identical. Also, the remaining four chips were calibrated at ambient and fit the calibration curve. This curve was used to calculate junction temperatures from voltage drop measurements.
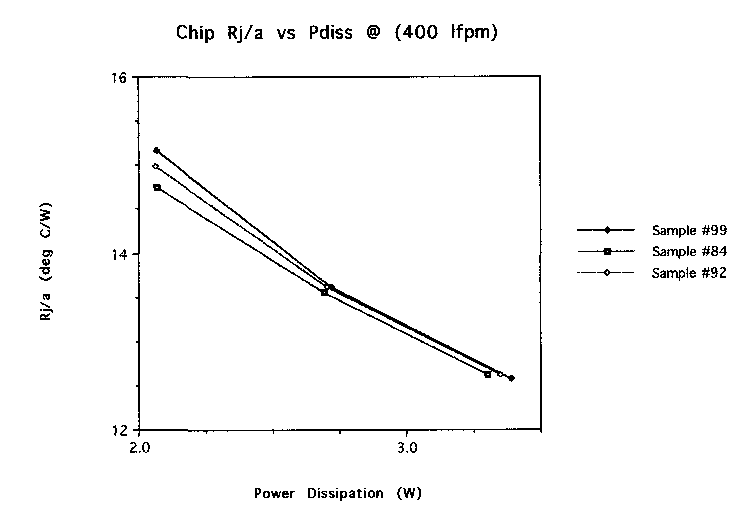
Appendix D lists the equilibrium results of the 19 tests run by Analysis Tech. The following figures are plots of the various test results. Note that all the tests were run at room ambient and no attempt to control the air temperature was made. For information it should be noted that the air temperature is listed in Appendix D as variable Tr. Figure One shows the Rj/a for the three chips at various power levels and 400 lfpm air velocity. The excellent agreement of the three samples shows that the test results on one device should apply to all devices.
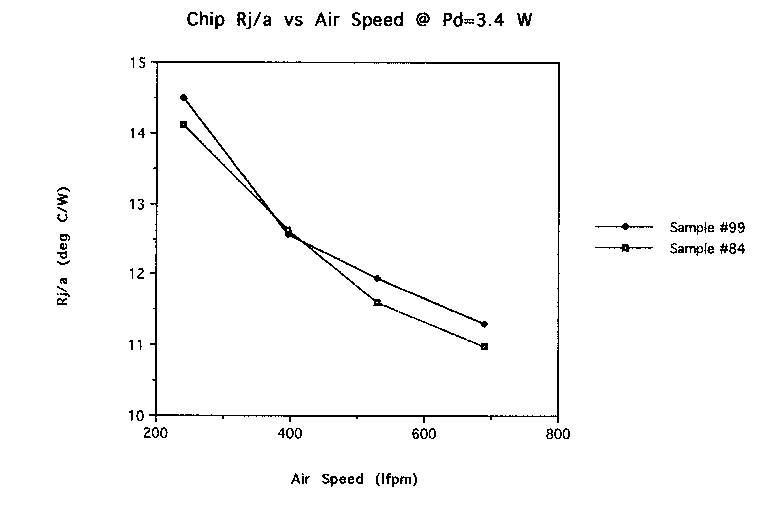
Figure Two plots the results of correlator chip samples #99 and #84 at a constant power dissipation (3.4W) with varying air speed. These plots also show close agreement between samples.
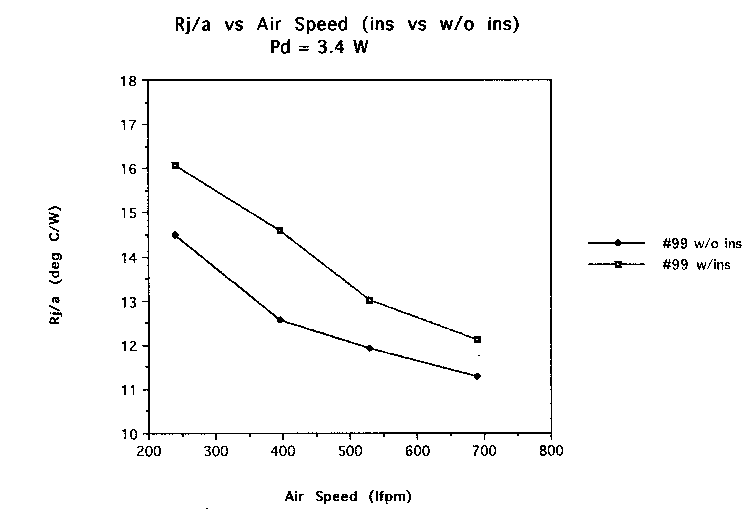
Figure Three shows plots of sample #99 at constant power dissipation with both uncovered and an insulated backside of the PCB. This test demonstrates the significance of the backside in terms of cooling the chip.
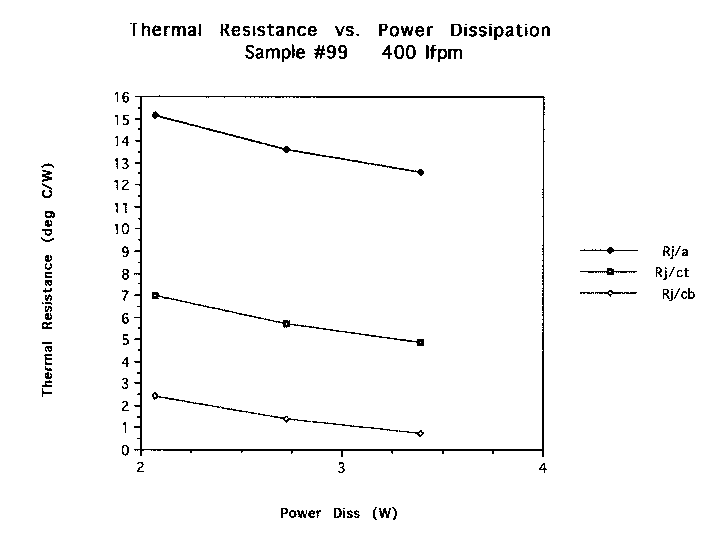
Figure Four shows the thermal resistance plots of sample #99 tested at constant air speed and varying power dissipation.

This test program provided an excellent resource for predicting actual junction temperatures for the Haystack VLSI Correlator Chips. Appendix D and the four figures contain the information necessary to determine thermal resistances for the final design. Since the digital crate is still in flux mechanically, accurate estimations of airflow over the correlator chips can not be made. This fact prevents making accurate junction temperature estimations. However, a number of things have been learned about these chips and how they behave thermally.
Figure One shows the close agreement of the three tested chips. These plots show that test data for one chip should be valid for all chips. Figure Two is very useful in that it shows Rj/a decreasing with increasing air velocity. A point is usually reached where increasing the air velocity does not decrease this value. This plot is valuable since it shows there is room to improve the heat transfer if the design requires by increasing the air velocity. It is reasonable to expect that one more velocity increment (150 lfpm to 850 lfpm) would produce linearly reduced resistances. However, increasing the air velocity comes at the expense of greater fan size, greater fan energy costs, and increased noise.
Figure Three displays the significantly higher Rj/a values with the PCB backside insulated. This shows that the backside heat transfer surface is significant to the overall chip operating temperature. The junction temperatures were between 2.8·C at 700 lfpm to 5.3·C at 250 lfpm higher with the insulation. This test was worth doing because the chip package is a “cavity up” one where the die is much closer to the package bottom. And the PCB design is one where the heat is primarily to be removed from the package top. This test has shown that improvements could be made to the chip bottom side heat transfer if required.
Figure Four shows the relative scale of the thermal resistances (Rj/a, Rj/ct, and Rj/cb) versus power dissipation. They decrease with increasing power dissipation as would be expected. This plot could be used as a reference to scale when determining a resistance at a point that was not tested for. Also, the resistances from the junction to case top (Rj/ct) can be used to determine actual junction temperatures if accurate convection coefficients are determined.
P=5(9.23x10⁻³)52=2.4 Watt + or - 10%
Unfortunately, we do not know the state of the rotators when this data
was taken, so there are several possibilities. (The rotators constitute
about 21% of the chip surface area.)
If the rotators were not running and
they might: Pmax=2.4(1.266)1.1=3.34 Watt
they won't: Pmax=2.4(1.0)1.1=2.64 Watt
If the rotators were running and
they might: Pmax=2.4(1.0)1.1=2.64 Watt
they won't: Pmax=2.4(0.79)1.1=2.09 Watt
Regards,
Will
Ken,
Here is a file (smith.cal) that contains the calibration data (Tj vs. Vj)
for one correlator chip. A second chip was also calibrated (with identical
results) on a second instrument which is currently operating, and can't be
accessed right now.
Give me a call if you have any questions.
Best Regards,
John Morley
Analysis Tech Phase 9 Thermal Analyzer Calibration Results
Date and time : 06-24-1997 05:28:38
Setup File Name: smith
Max # of pts : 12
Sense current : 1 mA
Pt #1 > Junction Temp. = 125.0 deg C at 0.198 volts on channel 1
Pt #2 > Junction Temp. = 120.0 deg C at 0.211 volts on channel 1
Pt #3 > Junction Temp. = 115.0 deg C at 0.225 volts on channel 1
Pt #4 > Junction Temp. = 110.0 deg C at 0.238 volts on channel 1
Pt #5 > Junction Temp. = 105.0 deg C at 0.252 volts on channel 1
Chan 1 Chan 2 Chan 3 Chan 4 Chan 5 Chan 6 Chan 7 Chan 8
------ ------ ------ ------ ------ ------ ------ ------
Slope (øC/V) -372
Offset (øC) 199
Mean Err (øC) 0.09
Max Err (øC) 0.1
Pt #6 > Junction Temp. = 100.0 deg C at 0.266 volts on channel 1
Chan 1 Chan 2 Chan 3 Chan 4 Chan 5 Chan 6 Chan 7 Chan 8
------ ------ ------ ------ ------ ------ ------ ------
Slope (øC/V) -370
Offset (øC) 198
Mean Err (øC) 0.09
Max Err (øC) 0.1
Pt #7 > Junction Temp. = 94.9 deg C at 0.280 volts on channel 1
Chan 1 Chan 2 Chan 3 Chan 4 Chan 5 Chan 6 Chan 7 Chan 8
------ ------ ------ ------ ------ ------ ------ ------
Slope (øC/V) -367
Offset (øC) 198
Mean Err (øC) 0.12
Max Err (øC) 0.2
Pt #8 > Junction Temp. = 90.0 deg C at 0.293 volts on channel 1
Chan 1 Chan 2 Chan 3 Chan 4 Chan 5 Chan 6 Chan 7 Chan 8
------ ------ ------ ------ ------ ------ ------ ------
Slope (øC/V) -367
Offset (øC) 197
Mean Err (øC) 0.10
Max Err (øC) 0.2
Pt #9 > Junction Temp. = 85.0 deg C at 0.306 volts on channel 1
Chan 1 Chan 2 Chan 3 Chan 4 Chan 5 Chan 6 Chan 7 Chan 8
------ ------ ------ ------ ------ ------ ------ ------
Slope (øC/V) -368
Offset (øC) 198
Mean Err (øC) 0.12
Max Err (øC) 0.3
Pt #10 > Junction Temp. = 80.0 deg C at 0.319 volts on channel 1
Chan 1 Chan 2 Chan 3 Chan 4 Chan 5 Chan 6 Chan 7 Chan 8
------ ------ ------ ------ ------ ------ ------ ------
Slope (øC/V) -369
Offset (øC) 198
Mean Err (øC) 0.13
Max Err (øC) 0.3
Pt #11 > Junction Temp. = 75.0 deg C at 0.332 volts on channel 1
Chan 1 Chan 2 Chan 3 Chan 4 Chan 5 Chan 6 Chan 7 Chan 8
------ ------ ------ ------ ------ ------ ------ ------
Slope (øC/V) -371
Offset (øC) 198
Mean Err (øC) 0.15
Max Err (øC) 0.4
Pt #12 > Junction Temp. = 70.0 deg C at 0.344 volts on channel 1
Chan 1 Chan 2 Chan 3 Chan 4 Chan 5 Chan 6 Chan 7 Chan 8
------ ------ ------ ------ ------ ------ ------ ------
Slope (øC/V) -373
Offset (øC) 199
Mean Err (øC) 0.19
Max Err (øC) 0.5
Smithsonian Correlator at 700 LFPM. Rja, Rjc1 and Rjc2 Sample #99
Recal: [Ch1 0.0] 06-26-1997 10:30
Ch# | Power | Tj | Vj | Tr | Ts | Tt | I-Rjx | A-Rjx
1 | 3.358 | 60.0 | 0.373 | 22.1 | | | 11.28 | 11.30 <EQ
1 | 3.358 | 60.0 | 0.373 | | 56.9 | | 0.92 | 0.95
1 | 3.358 | 60.0 | 0.373 | | | 42.7 | 5.15 | 5.17
POWER: (VportV, VportI, IportV, IportI) = 4.19V, 0.000A, 0.90V, 3.740A
------------------------------------------------------------------------------
Smithsonian Correlator at 550 LFPM. Rja, Rjc1 and Rjc2 Sample #99
Recal: [Ch1 0.0] 06-26-1997 10:44
Ch# | Power | Tj | Vj | Tr | Ts | Tt | I-Rjx | A-Rjx
1 | 3.313 | 62.4 | 0.366 | 22.6 | | | 12.00 | 11.94 <EQ
1 | 3.313 | 62.4 | 0.366 | | 58.9 | | 1.05 | 0.99
1 | 3.313 | 62.4 | 0.366 | | | 44.9 | 5.27 | 5.21
POWER: (VportV, VportI, IportV, IportI) = 4.20V, 0.000A, 0.89V, 3.706A
------------------------------------------------------------------------------
Smithsonian Correlator at 400 LFPM. Rja, Rjc1 and Rjc2 Sample #99
Recal: [Ch1 0.0] 06-26-1997 10:53
Ch# | Power | Tj | Vj | Tr | Ts | Tt | I-Rjx | A-Rjx
1 | 3.390 | 65.3 | 0.358 | 22.5 | | | 12.63 | 12.58 <EQ
1 | 3.390 | 65.3 | 0.358 | | 62.6 | | 0.79 | 0.74
1 | 3.390 | 65.3 | 0.358 | | | 48.5 | 4.97 | 4.91
POWER: (VportV, VportI, IportV, IportI) = 4.19V, 0.000A, 0.90V, 3.784A
------------------------------------------------------------------------------
Smithsonian Correlator at 250 LFPM. Rja, Rjc1 and Rjc2 Sample #99
Recal: [Ch1 0.0] 06-26-1997 10:58
Ch# | Power | Tj | Vj | Tr | Ts | Tt | I-Rjx | A-Rjx
1 | 3.351 | 71.6 | 0.342 | 23.1 | | | 14.48 | 14.49 <EQ
1 | 3.351 | 71.6 | 0.342 | | 69.5 | | 0.64 | 0.64
1 | 3.351 | 71.6 | 0.342 | | | 55.5 | 4.81 | 4.82
POWER: (VportV, VportI, IportV, IportI) = 4.19V, 0.000A, 0.89V, 3.767A
------------------------------------------------------------------------------
Smithsonian Correlator at 400 LFPM. Rja, Rjc1 and Rjc2 Sample #99
Recal: [Ch1 0.0] 06-26-1997 11:18
Ch# | Power | Tj | Vj | Tr | Ts | Tt | I-Rjx | A-Rjx
1 | 2.720 | 59.8 | 0.373 | 22.6 | | | 13.68 | 13.62 <EQ
1 | 2.720 | 59.8 | 0.373 | | 55.9 | | 1.45 | 1.39
1 | 2.720 | 59.8 | 0.373 | | | 44.0 | 5.79 | 5.73
POWER: (VportV, VportI, IportV, IportI) = 4.29V, 0.000A, 0.86V, 3.179A
------------------------------------------------------------------------------
Smithsonian Correlator at 400 LFPM. Rja, Rjc1 and Rjc2 Sample #99
Recal: [Ch1 0.0] 06-26-1997 11:27
Ch# | Power | Tj | Vj | Tr | Ts | Tt | I-Rjx | A-Rjx
1 | 2.067 | 53.8 | 0.389 | 22.3 | | | 15.22 | 15.17 <EQ
1 | 2.067 | 53.8 | 0.389 | | 48.6 | | 2.50 | 2.45
1 | 2.067 | 53.8 | 0.389 | | | 39.2 | 7.08 | 7.03
POWER: (VportV, VportI, IportV, IportI) = 4.40V, 0.000A, 0.81V, 2.543A
------------------------------------------------------------------------------
Smithsonian Correlator at 700 LFPM Rja, Rjc1 and Rjc2 Sample #99 insulated back
Recal: [Ch1 0.0] 06-26-1997 11:45
Ch# | Power | Tj | Vj | Tr | Ts | Tt | I-Rjx | A-Rjx
1 | 3.347 | 62.8 | 0.365 | 22.4 | | | 12.06 | 12.12 <EQ
1 | 3.347 | 62.8 | 0.365 | | 60.4 | | 0.72 | 0.78
1 | 3.347 | 62.8 | 0.365 | | | 46.1 | 4.99 | 5.05
POWER: (VportV, VportI, IportV, IportI) = 4.20V, 0.000A, 0.89V, 3.741A
------------------------------------------------------------------------------
Smithsonian Correlator at 550 LFPM Rja, Rjc1 and Rjc2 Sample #99 insulated back
Recal: [Ch1 0.0] 06-26-1997 11:52
Ch# | Power | Tj | Vj | Tr | Ts | Tt | I-Rjx | A-Rjx
1 | 3.312 | 65.3 | 0.358 | 22.4 | | | 12.97 | 13.03 <EQ
1 | 3.312 | 65.3 | 0.358 | | 63.2 | | 0.64 | 0.71
1 | 3.312 | 65.3 | 0.358 | | | 48.9 | 4.94 | 5.01
POWER: (VportV, VportI, IportV, IportI) = 4.21V, 0.000A, 0.89V, 3.716A
------------------------------------------------------------------------------
Smithsonian Correlator at 400 LFPM Rja, Rjc1 and Rjc2 Sample #99 insulated back
Recal: [Ch1 0.0] 06-26-1997 11:57
Ch# | Power | Tj | Vj | Tr | Ts | Tt | I-Rjx | A-Rjx
1 | 3.311 | 70.5 | 0.344 | 22.2 | | | 14.60 | 14.59 <EQ
1 | 3.311 | 70.5 | 0.344 | | 67.8 | | 0.81 | 0.80
1 | 3.311 | 70.5 | 0.344 | | | 53.7 | 5.08 | 5.06
POWER: (VportV, VportI, IportV, IportI) = 4.21V, 0.000A, 0.89V, 3.726A
------------------------------------------------------------------------------
Smithsonian Correlator at 250 LFPM Rja, Rjc1 and Rjc2 Sample #99 insulated back
Recal: [Ch1 0.0] 06-26-1997 12:06
Ch# | Power | Tj | Vj | Tr | Ts | Tt | I-Rjx | A-Rjx
1 | 3.359 | 76.9 | 0.327 | 22.8 | | | 16.11 | 16.07 <EQ
1 | 3.359 | 76.9 | 0.327 | | 75.0 | | 0.57 | 0.54
1 | 3.359 | 76.9 | 0.327 | | | 60.8 | 4.81 | 4.77
POWER: (VportV, VportI, IportV, IportI) = 4.20V, 0.000A, 0.89V, 3.788A
------------------------------------------------------------------------------
Smithsonian Correlator at 700 LFPM Rja, Rjc1 and Rjc2 Sample #84
Recal: [Ch1 0.0] 06-26-1997 12:55
Ch# | Power | Tj | Vj | Tr | Ts | Tt | I-Rjx | A-Rjx
1 | 3.369 | 59.3 | 0.375 | 22.3 | | | 10.97 | 10.98 <EQ
1 | 3.369 | 59.3 | 0.375 | | 56.3 | | 0.89 | 0.90
1 | 3.369 | 59.3 | 0.375 | | | 43.1 | 4.81 | 4.82
POWER: (VportV, VportI, IportV, IportI) = 4.21V, 0.000A, 0.90V, 3.740A
------------------------------------------------------------------------------
Smithsonian Correlator at 550 LFPM Rja, Rjc1 and Rjc2 Sample #84
Recal: [Ch1 0.0] 06-26-1997 13:04
Ch# | Power | Tj | Vj | Tr | Ts | Tt | I-Rjx | A-Rjx
1 | 3.316 | 60.9 | 0.370 | 22.4 | | | 11.62 | 11.60 <EQ
1 | 3.316 | 60.9 | 0.370 | | 58.2 | | 0.83 | 0.81
1 | 3.316 | 60.9 | 0.370 | | | 45.1 | 4.77 | 4.75
POWER: (VportV, VportI, IportV, IportI) = 4.22V, 0.000A, 0.89V, 3.707A
------------------------------------------------------------------------------
Smithsonian Correlator at 400 LFPM Rja, Rjc1 and Rjc2 Sample #84
Recal: [Ch1 0.0] 06-26-1997 13:11
Ch# | Power | Tj | Vj | Tr | Ts | Tt | I-Rjx | A-Rjx
1 | 3.304 | 64.5 | 0.361 | 22.8 | | | 12.62 | 12.63 <EQ
1 | 3.304 | 64.5 | 0.361 | | 62.0 | | 0.76 | 0.77
1 | 3.304 | 64.5 | 0.361 | | | 49.0 | 4.70 | 4.71
POWER: (VportV, VportI, IportV, IportI) = 4.22V, 0.000A, 0.89V, 3.708A
------------------------------------------------------------------------------
Smithsonian Correlator at 250 LFPM Rja, Rjc1 and Rjc2 Sample #84
Recal: [Ch1 0.0] 06-26-1997 13:19
Ch# | Power | Tj | Vj | Tr | Ts | Tt | I-Rjx | A-Rjx
1 | 3.364 | 70.6 | 0.344 | 22.9 | | | 14.16 | 14.11 <EQ
1 | 3.364 | 70.6 | 0.344 | | 68.8 | | 0.53 | 0.48
1 | 3.364 | 70.6 | 0.344 | | | 55.7 | 4.43 | 4.38
POWER: (VportV, VportI, IportV, IportI) = 4.21V, 0.000A, 0.89V, 3.777A
------------------------------------------------------------------------------
Smithsonian Correlator at 400 LFPM Rja, Rjc1 and Rjc2 Sample #84
Recal: [Ch1 0.0] 06-26-1997 13:29
Ch# | Power | Tj | Vj | Tr | Ts | Tt | I-Rjx | A-Rjx
1 | 2.693 | 58.5 | 0.377 | 22.1 | | | 13.55 | 13.56 <EQ
1 | 2.693 | 58.5 | 0.377 | | 55.6 | | 1.08 | 1.09
1 | 2.693 | 58.5 | 0.377 | | | 44.5 | 5.20 | 5.21
POWER: (VportV, VportI, IportV, IportI) = 4.31V, 0.000A, 0.85V, 3.155A
------------------------------------------------------------------------------
Smithsonian Correlator at 400 LFPM Rja, Rjc1 and Rjc2 Sample #84
Recal: [Ch1 0.0] 06-26-1997 13:37
Ch# | Power | Tj | Vj | Tr | Ts | Tt | I-Rjx | A-Rjx
1 | 2.068 | 52.5 | 0.393 | 22.1 | | | 14.68 | 14.75 <EQ
1 | 2.068 | 52.5 | 0.393 | | 48.6 | | 1.86 | 1.94
1 | 2.068 | 52.5 | 0.393 | | | 39.7 | 6.17 | 6.24
POWER: (VportV, VportI, IportV, IportI) = 4.41V, 0.000A, 0.81V, 2.544A
------------------------------------------------------------------------------
Smithsonian Sample #92 400 LFPM
Recal: [Ch1 0.0] 06-26-1997 13:56
Ch# | Power | Tj | Vj | Tr | Ts | Tt | I-Rjx | A-Rjx
1 | 3.348 | 65.0 | 0.359 | 22.6 | | | 12.66 | 12.62 <EQ
1 | 3.348 | 65.0 | 0.359 | | 62.4 | | 0.78 | 0.74
1 | 3.348 | 65.0 | 0.359 | | | 49.5 | 4.63 | 4.59
POWER: (VportV, VportI, IportV, IportI) = 4.23V, 0.000A, 0.91V, 3.662A
------------------------------------------------------------------------------
Smithsonian Sample #92 400 LFPM
Recal: [Ch1 0.0] 06-26-1997 14:06
Ch# | Power | Tj | Vj | Tr | Ts | Tt | I-Rjx | A-Rjx
1 | 2.702 | 59.3 | 0.375 | 22.3 | | | 13.68 | 13.63 <EQ
1 | 2.702 | 59.3 | 0.375 | | 55.9 | | 1.24 | 1.19
1 | 2.702 | 59.3 | 0.375 | | | 45.0 | 5.27 | 5.22
POWER: (VportV, VportI, IportV, IportI) = 4.32V, 0.000A, 0.87V, 3.097A
------------------------------------------------------------------------------
Smithsonian Sample #92 400 LFPM
Recal: [Ch1 0.0] 06-26-1997 14:11
Ch# | Power | Tj | Vj | Tr | Ts | Tt | I-Rjx | A-Rjx
1 | 2.063 | 53.7 | 0.390 | 22.6 | | | 15.05 | 14.99 <EQ
1 | 2.063 | 53.7 | 0.390 | | 49.1 | | 2.20 | 2.14
1 | 2.063 | 53.7 | 0.390 | | | 40.3 | 6.46 | 6.40
POWER: (VportV, VportI, IportV, IportI) = 4.42V, 0.000A, 0.83V, 2.493A
Thermocouple Legend
Tr = Ambient Thermocouple
Ts = Bottom Case Thermocouple
Tt = Top Case Thermocouple