Variability Surveys
Variable stars were first detected by people simply looking up at the night sky and noticing that a particular star had changed its brightness since the last time they looked. Later, astronomers of course began to use telescopes to examine the sky and so could study variables in more detail, see fainter variables and therefore more of them. Then, astrophotography began, where cameras with photographic plates were mounted to telescopes, so that even more and fainter variables could be found, with more accurate measurements of their brightness available from the photographs. Since the mid-1980s, the cameras on telescopes increasingly use light-sensitive electronic devices called CCDs ('charge-coupled devices'). Astronomical CCDs are similar to the chip in your digital camera or phone, but tend to be larger and more sensitive. When a photon of light hits a CCD, it liberates electrons from an element (a pixel) of the silicon chip. Those electrons are shuffled along the silicon mosaic and read out as an array of numbers that constitutes a digital image.
These days, large CCD cameras can be mounted on telescopes specifically designed to quickly scan wide areas of sky, allowing systematic variability surveys to be performed. Indeed, numerous different variability surveys have been designed and built in the last decade or two, and there are many more to come. Each such survey creates 'movies' of the sky that can be rapidly analyzed by computers to find and measure variables. Where astronomy used to be primarily the study of interesting objects, a variety of new multi-epoch surveys making "sky movies" is yielding incredible new science by detecting variables and transients like those described here on the SDU website: pulsating stars, eclipsing binary stars, novae and supernovae, etc. Astronomy has entered the time domain.
To detect and measure variability, a digital image of a particular part of the sky is scanned. Peaks in brightness are identified and cataloged as objects. Each object’s brightness is measured by summing the number of electrons around it. When additional images are taken at different times (epochs), the brightness of the object can be tracked, and changes in brightness detected if it is a variable.
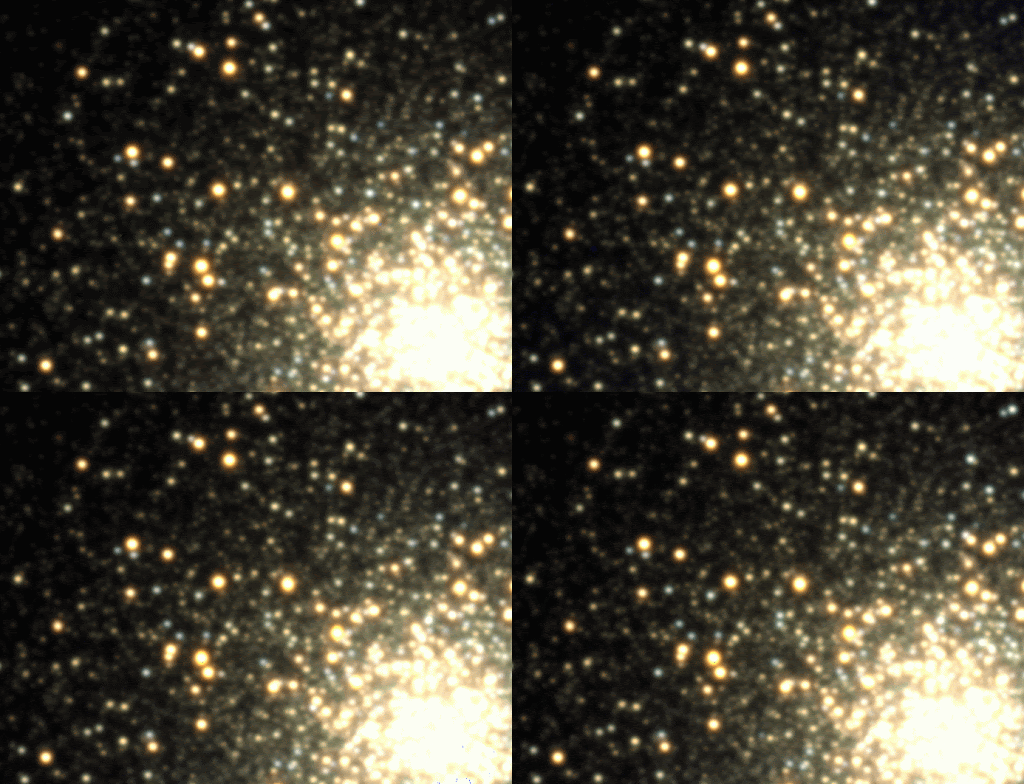
Below is an animated GIF of part of the globular star cluster Messier 3, with 4 images taken at different times. Most objects do not vary, but there are a handful that clearly change their brightness over time. Most of the objects that can be seen as variable are RR Lyrae stars, which tend to be blue because their temperatures are hotter than most of the other stars in this cluster.

Below, we outline some of the major multi-epoch imaging surveys useful for detecting celestial variables.
The Vera Rubin Observatory
The largest ever survey for variables which began in mid-2025, is the Vera Rubin Observatory in Chile. The survey is expected to run for 10 years, with the ability to scan the entire available southern sky every three nights. Using an 8.4 meter telescope, the VRO will detect very faint objects in multiple color filters, and provide a massive data stream of new transients and variables to the public.
SDSS
At the start of this millennium, the Sloan Digital Sky Survey (SDSS) made the first large-scale digital color images of the sky, using a wide-field scanning camera that took images simultaneously through 5 different color filters, eventually mapping most of the northern sky. SDSS detected objects as faint as about magnitude 22, more than a million times fainter than what a human eye can see.
SDSS also made the first large-area color 'movie' of the sky. In a region they called "Stripe 82". SDSS re-imaged that same strip of sky (290 square degrees, or about 1,500 times the size of the full moon) more than 60 times over a decade, allowing for many large variability studies.
In later phases, the SDSS focused entirely on obtaining spectroscopy for millions of the stars, galaxies and quasars found in the original images.
Pan-STARRS
Between 2010-2014, the Pan-STARRS1 (PS1) survey covered 75% of the sky in 5 colors, using a 1.8-meter diameter telescope located near the summit of Haleakala on the island of Maui. An enormous digital camera with almost 1.4 billion pixels scanned about 1,000 square degrees per night (about 5,000 times the size of the full moon, but only about one fortieth of the whole sky). Each part of the sky was imaged about 12 separate times during the 3-year survey. PS1 detected objects as faint as about magnitude 23.
Zwicky Transient Facility
The Zwicky Transient Facility (ZTF) uses a large, fast read-out CCD camera and a special classic design called a Schmidt Telescope, on Mount Palomar in California. The ZTF repeatedly images about 75% of the sky in three different filters. ZTF detects objects as faint as about magnitude 22 and has performed more than 100 visits over most of its area.
Most of the optical light curves and spectra for the SDU project were obtained by the ZTF and analyzed as part of the Time Domain Spectroscopic Survey (TDSS; see below).
ASAS-SN
Using 20 small (14-cm) telescopes distributed in South Africa, Chile, Texas and Hawaii, the All-Sky Automated Survey for Supernovae (ASAS-SN) covers the entire sky available in a given season about every 5 days, probing as faint as about 17th magnitude.
Catalina Sky Survey
The Catalina Sky Survey (CSS) primarily used 3 telescopes in the Santa Catalina Mountains near Tucson, detecting objects as faint as about magnitude 19.
TDSS
The Time Domain Spectroscopic Survey (TDSS) used the capability of the Sloan Digital Sky Survey (SDSS) multi-fiber spectrograph to obtain spectra of more than 100,000 variable objects pre-selected to about magnitude 21 by comparing SDSS and PS1 magnitudes. The spectra reveal that about one third of the variables are stars, and two-thirds are quasars.

