
 Main M31 Menu
|
00:44:57.5 41:55:14.7 Velocity: -103.66 Type: HII Log NII/Hα: -0.522 Log OIII/Hβ: 0.237 Log SII/Hα -0.444 Log OI/Hα -99.900 Hα FWHM : (4.700) m475: vmag Log Mass: mass Comments: For ones with broad lines (>100 km/s) I gave the -103.66 range near the base and put 'y'. For obviously narrow ones, I did a Gaussian fit, and the three numbers are the peak counts, the centroid and the Gaussian sigma of the fit. If the width is below 20 km/s, I put a 'n' unless there seemed to be faint, high -103.66 wings, in which case I put 'p' For the ones wider than 20 km/s, I put 'p'. |
|

 Spec_________________________________________________________Chelle
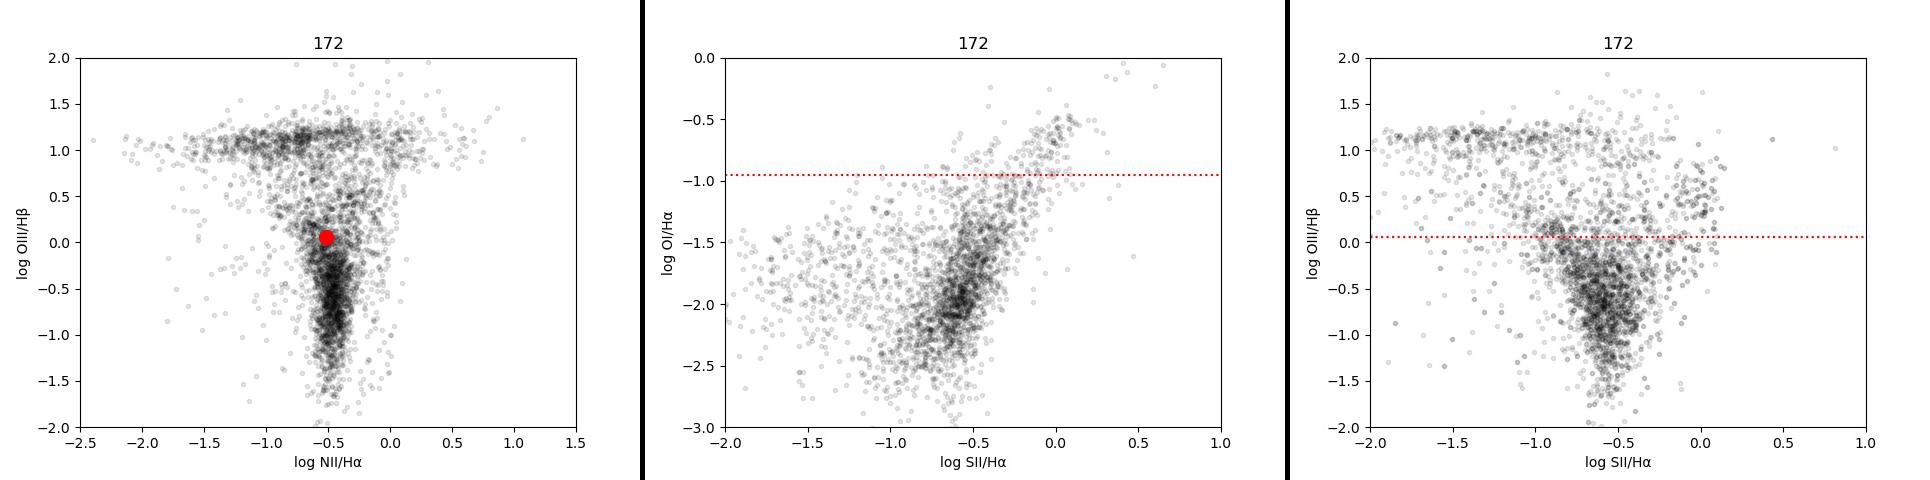 BPT diagrams