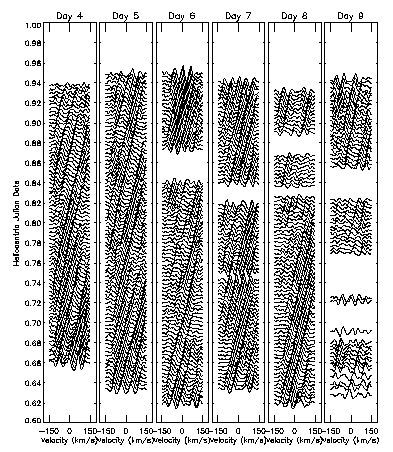
Using the AFOE, the line-profile variations of tau Peg were re-investigated during six consecutive nights at the Whipple Observatory. Information about the oscillations was extracted from the spectra using the new technique of Doppler Deconvolution. The time series of residual line profile variations (after subtracting the mean profile) is shown below.

The frequencies and modes of tau Peg were identified using the technique of Fourier-Doppler imaging and a two-dimensional least-squares cleaning algorithm. First, the line-profile variations were transformed in time and Doppler space to a new two-dimensional Fourier representation. The result is shown below.

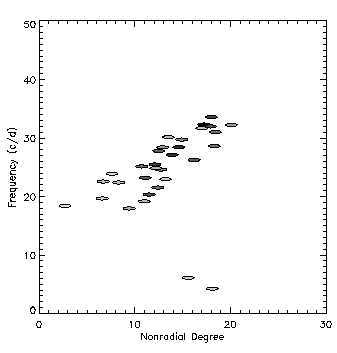
Then, the line-profile variations were modeled as the sum of several two-dimensional sinusoids, using frequencies estimated from the peaks in the two-dimensional Fourier spectrum as the initial guesses. The frequencies that were identified are illustrated below. The shade of the symbol indicates the amplitude of the variation.

We find a rich spectrum of some 30 modes with degrees up to l = 20 and with frequencies below about 35 cycles/day. Those modes with the largest amplitudes have frequencies that lie within a narrow band. We conclude that the observed spectrum can be explained if the modes of tau Peg propagate in the prograde direction with l about equal to m and with frequencies that are approximately equal in the co-rotating frame of the star.