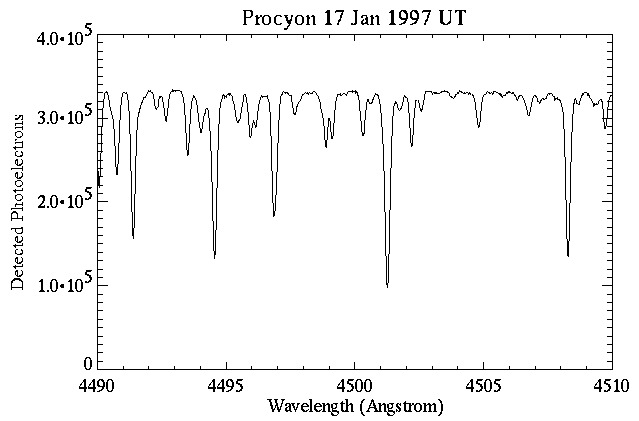
Figure 1 shows a typical 20-Angstrom piece of a Procyon spectrum
We have gathered AFOE observations of Procyon's radial velocity every observing season for several years. In January 1997, in cooperation with a simultaneous campaign to measure the equivalent widths of hydrogen Balmer lines, organized by the Stellar Oscillation Network Group ( SONG), we succeeded in getting our best observations to date. We obtained good data on 8 of 10 nights between 16 Jan. and 25 Jan, with exposure times of 2 min and typical signal-to-noise ratio of about 400:1. Each exposure lasted 2 minutes; with a maximum time coverage of a bit over 7 hours per night, we ended the run with more than 1000 spectra.

Figure 1
shows a typical 20-Angstrom piece of a Procyon spectrum
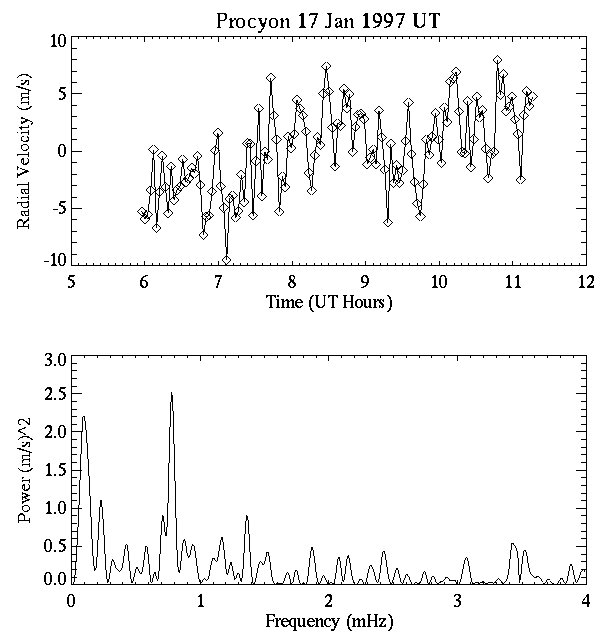
We used these spectra to measure the radial velocity of Procyon relative to the wavelengths of lines from a Th-Ar emission lamp. The time series of velocities measured during the first night of observations is shown below. The zero point is arbitrary. There is an evident trend of uncertain origin in the measured velocities; this may be an instrumental problem, or it may have to do with slow processes occurring in the atmosphere of the star. After subtracting a straight-line fit to remove this trend, we computed the power spectrum of the residuals, which is also shown below. The scatter in the detrended velocity time series is about 3.4 m/s rms. The power spectrum suggests that three different kinds of signal contribute to this variation: (1) A slow variation with frequency near 0.1 mHz (period about 3 hours) and amplitude near 1.6 m/s, which may be of either stellar or instrumental origin. (2) A more rapid variation with frequency near 0.8 mHz (period about 20 min), also with amplitude about 1.6 m/s. This component is in the frequency range expected for oscillatory or convective motions in the atmosphere of Procyon. (3) A white noise component distributed more or less evenly in frequency, with a total associated variation of about 2.0 m/s rms. This is a combination of photon shot noise and noise from other (mostly instrumental) sources.

Figure 2
shows velocity time series for 16 Jan 1997, and power spectrum
of detrended velocity series.
We are proceeding with analysis of the other nights of data. The first indications are that their behavior is qualitatively similar to that of the first night, but that the locations of power spectrum peaks found between 0.5 and 1.5 mHz do not repeat from night to night. Qualitatively, the power spectrum averaged over several nights looks similar to that illustrated by Brown et al. (1991). Further results concerning the new observations will soon be submitted for publication.