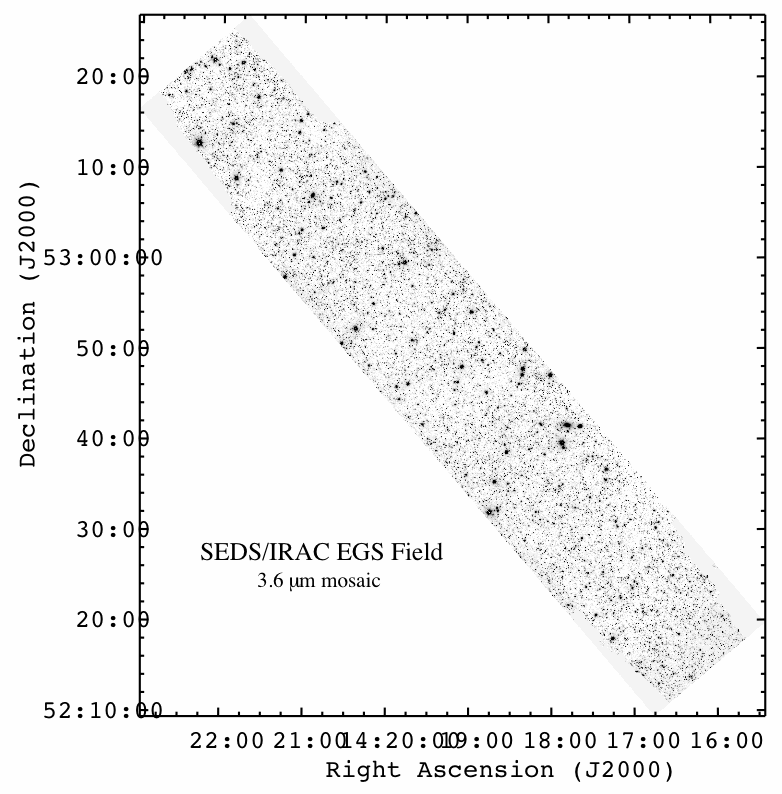
|
The EGS field was observed in three epochs with approximate dates shown below. Click on the channels for coverage maps in FITS format. (These files are 2.3 Mb each at 3 arcsec resolution; You probably want to right click and save the files on your local machine.) For a ds9 region file showing the approximate coverage, click here. |
| Epoch 1 = 2010-02 | Epoch 2 = 2010-08 | Epoch 3 = 2011-02 | Total |
|---|---|---|---|
| ch1 = 3.6 μm | ch1 = 3.6 μm | ch1 = 3.6 μm | ch1 = 3.6 μm |
| ch2 = 4.5 μm | ch2 = 4.5 μm | ch2 = 4.5 μm | ch1 = 4.5 μm |

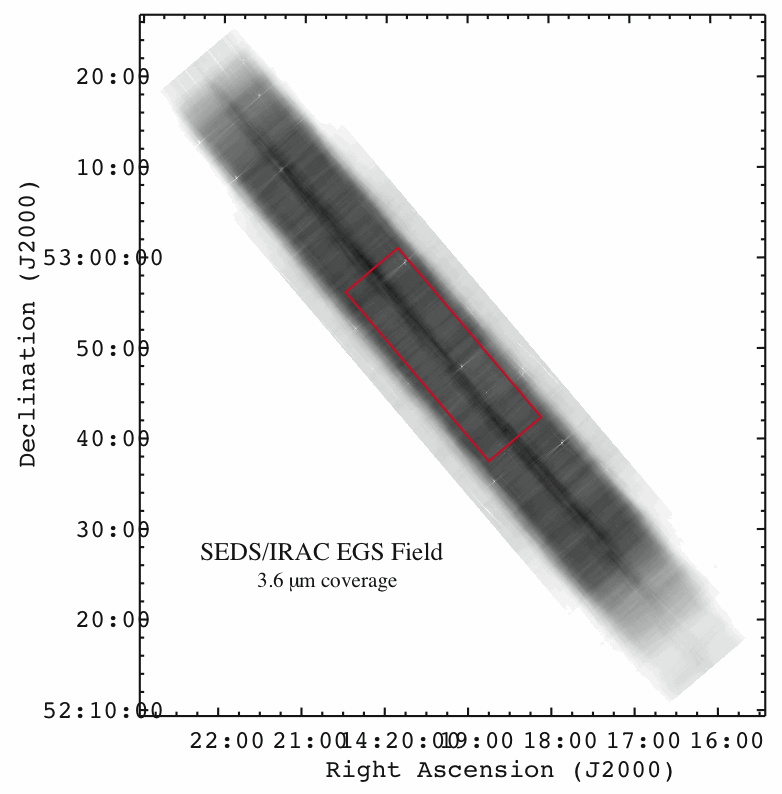
The following plot shows the same 3.6 micron SEDS coverage of the EGS field, with the red rectangle indicating the HST (CANDELS Wide-field) coverage.

Return to SEDS Home Page