Modelling the Far-IR Emission from Molecular Clouds
Scott Schnee, Tom Bethell, Alyssa Goodman
Publications
Scott L. Schnee, T. Bethell, Alyssa A. Goodman, " Estimating Column Density in Molecular Clouds Using Far-IR and Sub-mm Emission Maps", 2006, ApJ, 640, L47.
Scott L. Schnee, Naomi A. Ridge, Alyssa A. Goodman, Jason G. Li, "A COMPLETE Look at the use of IRAS Emission Maps to Estimate Extinction and Dust Temperature". 2005, ApJ, 634, 442.
Figures

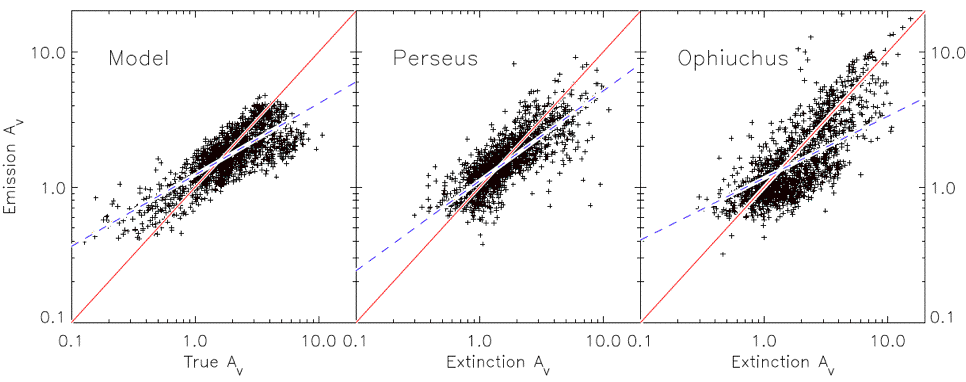
The scatter in the relationship between emission-based and extinction-based measures of column density is primarily due to the assumption of line-of-sight isothermality. Schnee et al. (2005) presents a method for optimizing far-IR-derived measures of column density using extinction-mapping for calibration. The middle and right panel above show that even after this optimization is carried out for the full COMPLETE fields, substantial scatter in the plots of Emission vs. Extinction measures of AV remains. The leftmost plot shows the result of a synthesized observation of a numerical simulation of a realistically turbulent cloud using the same wavelengths (60 and 100 microns), noise levels, and assumptions as in the COMPLETE analysis. Notice that the scatter in the simulation emulates the data--even though the dust in the simulation has a single value of the emissivity spectral index (b) throughout. Nearly all of the scatter is produced by the (false!) assumption of a single line-of-sight temperature in each map pixel.
COMPLETE Web Master: Sarah Block • COMPLETE PI: Alyssa Goodman
This material is based upon work supported by the National Science Foundation under Grant No. AST-0407172.
Any opinions, findings, and conclusions or recommendations expressed in this material are those of the author(s)
and do not necessarily reflect the views of the National Science Foundation.
Document URL: lweb.cfa.harvard.edu/COMPLETE/projects/fir.html
Last Modified: Thursday, 08-Jun-2006 12:28:45 EDT